Electro Plate Tectonics
Part 2
Marc Linquist
Independent researcher at;
Independent researcher at;
Index
Part 1 Page 1 Introduction
Page 2 Abstract
Page 3 A model of the basic plate movement dynamics
Page 4 Direct evidence of the solar magnetic coupling to plate movement
Page 5 A simple model of dynamical possibilities
Page 6 A model of a crustal compression mechanism (Compressive Engine)
Page 7 A model for the strain energy forcing of the climate Page 8 A model for mantle driven climate variability
Page 9 Evidence of a correlated and cyclical behavior of crustal movement and climate
Page 10 Evidence that the model accurately predicts the observations of crustal behavior
Page 11 A model of seafloor dynamics
Page 12 A model of convergent dynamics
Page 13 A model for extensional dynamics
Page 14 A model of convergent boundary dynamics
Page 15 Evidence of repeated episodes of slab advance and slab retreat, slab break-off
Page 16 Prediction of double Benioff zones
Page 17 Processing of accumulated sedimentary materials at convergent margins
Page 18 A prediction of divergent boundary development
Page 19 A model of Atlantic divergent boundary dynamics
Page 20 A model for Continental breakup
Page 21 A model for the dynamic operation of the core-mantle thermal expansion mechanism
Page 22 Model of Hawaiian Island chain and the Emperor Seamount Chain
Part 2
Page 23 A mechanism for producing hydraulic magma at the crust/mantle boundary
Page 24 Hotspot formation and large eruptive discharge events
Page 25 Mechanism for high speed continental movement
Page 26 Mechanism for Mountain formation
Page 27 Model for the creation, storage and distribution of: Compression and Gravitational Potential Energy within the crust
Page 28 Model for globally simultaneous boundary deformation with subsequent and significant carbon isotope excursions and mass extinctions (Evolutionary Mechanism)
Page 29 Correlation of extensional and compressional episodes to Miocene, Pliocene and Pleistocene temperature record.
Page 30 A model for Mountain ranges on Continental interiors
Page 31 A model for plate dynamics of oceanic slab break-off and relocation Page 32 Evidence of Periodic Extension/compression Cycles in Oceanic Lithosphere
Page 33 A few images of crustal compression at work
Page 34 Summery
-------------------------------------------------------------------------------------------------------------------------------------------------------
Part 2
Page 23
A mechanism for producing
Hydraulic magma at the
Crust/mantle boundary
-----------------------------------------------------------------------------------------------------------------------------------------------------------------------------------------------------------------
9.1 As the Earth warms during a long term solar magnetic increase, the periodic expansion of the outer core for a period lasting 1 million years or more would produce at the slowly expanding surface of the mantle, what looks to be as the melting away of the surface. The volume of hydraulic magma stays within the observed parameters of;
- the solar magnetic energy strength.
- the core/outer core thermal flux
- the degree of mantle displacement
- and the mid ocean ridge infill
The resulting magmatic fluid that is produced at the many locations where the mantle surface becomes torn from the strain tension, enables the frictional movement that is applied to the tectonic plates by the displacing mantle. The eventual cooling that periodically divides the thermal cycle marks the mantle's reclamation of the magma sources through, again, temperature and pressure, reforming the mantle material into the thermoplastic rock that supports the outer shell of the planet.
9.2
https://www.nsf.gov/news/news_summ.jsp?cntn_id=127315
March 20, 2013
Scientists Discover Layer of Liquefied Molten Rock in Earth's Mantle
Hidden magma layer could play role in shaping the geologic face of our planet
"Scientists have discovered a layer of liquified molten rock in Earth's mantle that may be responsible for the sliding motions of the planet's massive tectonic plates." . . . ."The finding may carry far-reaching implications, from understanding basic geologic functions of the planet to new insights into volcanism and earthquakes." . . . ."The scientists discovered the magma layer at the Middle America trench off Nicaragua's shores."
"the scientists imaged a 25-kilometer- (15.5-mile-) thick layer of partially melted mantle rock below the edge of the Cocos plate where it moves beneath Central America."
"For decades scientists have debated the forces that allow the planet's tectonic plates to slide across the Earth's mantle."
""Our data tell us that water can't accommodate the features we are seeing," said Naif. "The information from the new images confirms the idea that there needs to be some amount of melt in the upper mantle. That's what's creating this ductile behavior for plates to slide.""
""One of the longer-term implications of our results is that we are going to understand more about the plate boundary, which could lead to a better understanding of earthquakes," said Key.""
"The researchers are now trying to find the source that supplies the magma in the newly discovered layer."
This model's simple mantle displacement mechanism provides that source of boundary area mantle melt.
9.3
http://geoprisms.org/newsletters/imaging-the-nicaragua-subduction-zone-with-marine-electromagnetic-methods/
Imaging the Nicaragua Subduction Zone with Marine Electromagnetic Methods
Samer Naif1, Kerry Key1, Steven Constable1, Rob L. Evans2
1SCRIPPS Institution of Oceanography, 2Woods Hole Oceanographic Institute
Modified from Naif, S., Key, K., Constable, S., Evans, R.L., 2013.
Melt-rich channel observed at the lithosphere-asthenosphere boundary. Nature 495, 356-359.
"There are three competing hypotheses often invoked to explain the oceanic LAB that is prominent in seismic and EM observations: 1) a thermal boundary, 2) a hydration boundary, 3) a partial melt boundary (Fischer et al., 2010). From the existing laboratory studies of the electrical conductivity of expected mantle phases, the signature of our observed channel is too conductive to be explained with either temperature or hydrated olivine alone. Such high conductivity measurements require an interconnected network of 1-2% hydrated basaltic melt. Alternatively, a recent study suggests that 0.3-0.5% of highly enriched incipient melt is a more plausible interpretation (Sifré et al., 2014)."
9.4 This mechanism allows the mantle to transform the core's thermal expansion increase into strain energy displacement at the core-mantle boundary, and then convert a large part of it from strain displacement back to thermal energy at the surface of the asthenosphere. It is a mechanism that can quickly transport the core's thermal derived expansion as strain energy movement through the mantle to the crust. This allows the solar magnetic field's variability to influence, even impose short and long time scale thermal forcing into the Earth's crust, ocean and biosphere. The timing of the short and long cycle periods can be compared to the periodicity of Ice Age and glacial-interglacial events, where larger cycle periods are divided by smaller two way transient movements of temperature of which they are most likely connected. The upper mantle may work as a heat sink, moderating the heat cycle. The phenomenon is supplying large volumes of magma that “float” the plates and furnish divergent plate boundaries with magmatic building material.

-----------------------------------------------------------------------------------------------------------------
Page 24
Hot spot formation and
Large eruptive discharge events
------------------------------------------------------------------------------------------------------------------------------------------------------------------------------------------------------------------
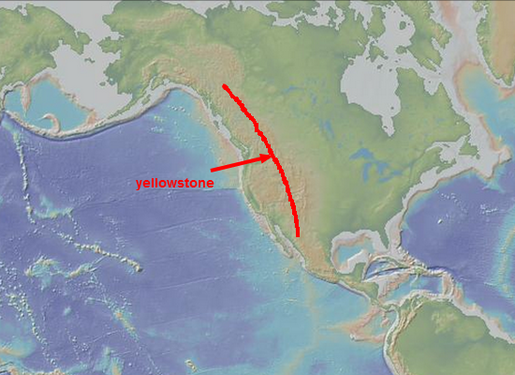
9.5 There are a number of historic basaltic eruptive events that I believe are related to large displacement caused mantle-tears in the mantle's surface; these are deep expansion fractures from past high thermal events. Siberian Traps of 250 million years ago, the Ontong Java Plateau at 125–120 million years ago and the Deccan Traps at the end of the cretaceous period 60 - 68 million years ago. And I think they are related to the various current hot spot phenomenon that include the Hawaiian Islands, the Yellowstone complex, Iceland, Réunion, and Galápagos to name a few.
But first Iceland, if this is a hotspot has it stayed aligned with the Atlantic spreading center since the continents first separated? In the new model the mid-ocean ridge resulted from the lack of a differential of allowable movement in the oversized continental tectonic plate, resulting in it succumbing to the strain energy displacement of the upper mantle from thermal expansion of the magnetic field generating components. These old sutured seams joining the assembled cratons together will eventually yield to the persistent cycles of mantle displacement.
But, could a hotspot like Yellowstone have assisted the process? Could the one under Iceland have been there from the beginning when the continents first separated? Was it because the preexisting sutured seam that first activated and created the Mid-Atlantic Ridge was directly over where the mantle produced a mantle hotspot like the Hawaiian-Emperor chain? Or did it arrive there by way of geologic processes similar to Yellowstone's current situation?
Image above used and modified by this author was furnished through and in no way endorsed by://www.geomapapp.org using Global Multi-Resolution Topography (GMRT) Synthesis,
Ryan, W. B. F., S.M. Carbotte, J. Coplan, S. O'Hara, A. Melkonian, R. Arko, R.A. Weissel, V. Ferrini, A. Goodwillie, F. Nitsche, J. Bonczkowski, and R. Zemsky (2009), Global Multi-Resolution Topography (GMRT) synthesis data set, Geochem. Geophys. Geosyst., 10, Q03014, doi:10.1029/2008GC002332.
9.6 Yellowstone now lies under western North America. Yellowstone's extinct historic surface anomalies trailing across Oregon, Idaho and Wyoming. Mantle plume theory proponents claim these hotspots are the result of a plume, while large scale convection currents are believed to be causing the oceanic plates to separate at the divergent boundaries. But does that scenario really work in the case of the Atlantic? The North American and African tectonic plates rifted apart 200 million years ago, the resulting basaltic lava lasted for 600,000 years and covered more than 9 million square kilometers (3.5 million square miles).
9.7 This model can accommodate the mantle plume hypothesis and convection cells, but the plume hypothesis' complexities muddy the waters of the current standard model and would do the same with this hypothesis. And under closer examination it would seem difficult for convective currents to exist and maintain continuity in a mantle that was expanding and contracting in 3-4 million year periodicities. Increased complexity is always moderated by reduced probability. Occam's Razor favors the least number of mechanisms to accomplish the task and this hypothesis gains nothing through adding unneeded processes. The model’s simple transfer of energy through electro-thermo-kinetic relay produces causative mechanisms for any and all current phenomenon that mantle plume and even convection cell hypotheses tenuously attempt to explain.
9.71 Mid-Ocean ridges are the result of a continental break-up that forms a new oceanic crust spreading center and a future ocean basin such as with the Atlantic. The model contends that during larger solar magnetic induction periods the mantle boundary surface will be stressed and acquire tension to an increased proportion. Due to the mantle's thermoplastic nature it will tear at thermally higher, and by that weaker boundary surface area locations. These will be symmetrically located across the mantle boundary area surface in proportion to the mantle's coefficient of restitution. These areas are where mantle heat and friction during the displacement are more likely to be concentrated, under large continental structures. Additionally the friction of the differential of allowable movement in the slowly spreading, and by that stretching continental crust would produce additional divergent mechanical force on the mantle's boundary surface, further adding the formation of these large magma and thermal reservoirs. This would provide a continuous process for continental break-up and seafloor generation to the already hypothesized cycles currently studied in this paper.
9.8 This model proposes the ancient hyper thermal extinction events are simply in line with what would be expected if solar magnetic energies were high enough to produce large expansion and production of magmatic fluid that exceeded the differential of allowable movement of the crust, resulting in the expansion fracturing of the crust and lava discharges. The solar magnetic energy levels that would produce large discharges would require the mantle to expand and fracture its surface in large tears producing large volumes of hydraulic magma. The surface tension in the crust will build to critical levels until the crust fractures at its weakest point from the extreme tension. The crustal fracture would likely occur directly over a large mantle tear where the most heat and pressure would be present to weaken the crust.
The larger mantle tears take longer to re-close due to the mantle's high viscosity, and remain filled with residual magma for protracted time periods that are in proportion to the energy that created the hyperthermal event. These larger thermal expansion periods cause the mantle surface to expose the overlying crust to extreme levels of heat and pressure. As the mantle's surface radially expands beyond the crust's rate of allowable/or differential of movement the crust will fracture at its weakest point, allowing ejecting magma out of the fracture for the duration of the solar magnetic field's high energy period. These are the hyperthermal events that include the historic Siberian Traps of 250 million years ago, the Ontong Java Plateau at 125–120 million years ago and the Deccan Traps at the end of the cretaceous period 60 - 68 million years ago.
9.5 There are a number of historic basaltic eruptive events that I believe are related to large displacement caused mantle-tears in the mantle's surface; these are deep expansion fractures from past high thermal events. Siberian Traps of 250 million years ago, the Ontong Java Plateau at 125–120 million years ago and the Deccan Traps at the end of the cretaceous period 60 - 68 million years ago. And I think they are related to the various current hot spot phenomenon that include the Hawaiian Islands, the Yellowstone complex, Iceland, Réunion, and Galápagos to name a few.
But first Iceland, if this is a hotspot has it stayed aligned with the Atlantic spreading center since the continents first separated? In the new model the mid-ocean ridge resulted from the lack of a differential of allowable movement in the oversized continental tectonic plate, resulting in it succumbing to the strain energy displacement of the upper mantle from thermal expansion of the magnetic field generating components. These old sutured seams joining the assembled cratons together will eventually yield to the persistent cycles of mantle displacement.
But, could a hotspot like Yellowstone have assisted the process? Could the one under Iceland have been there from the beginning when the continents first separated? Was it because the preexisting sutured seam that first activated and created the Mid-Atlantic Ridge was directly over where the mantle produced a mantle hotspot like the Hawaiian-Emperor chain? Or did it arrive there by way of geologic processes similar to Yellowstone's current situation?
Image above used and modified by this author was furnished through and in no way endorsed by://www.geomapapp.org using Global Multi-Resolution Topography (GMRT) Synthesis,
Ryan, W. B. F., S.M. Carbotte, J. Coplan, S. O'Hara, A. Melkonian, R. Arko, R.A. Weissel, V. Ferrini, A. Goodwillie, F. Nitsche, J. Bonczkowski, and R. Zemsky (2009), Global Multi-Resolution Topography (GMRT) synthesis data set, Geochem. Geophys. Geosyst., 10, Q03014, doi:10.1029/2008GC002332.
- Data doi: 10.1594/IEDA.0001000, through http://creativecommons.org/licenses/by-nc-sa/3.0/us/
9.6 Yellowstone now lies under western North America. Yellowstone's extinct historic surface anomalies trailing across Oregon, Idaho and Wyoming. Mantle plume theory proponents claim these hotspots are the result of a plume, while large scale convection currents are believed to be causing the oceanic plates to separate at the divergent boundaries. But does that scenario really work in the case of the Atlantic? The North American and African tectonic plates rifted apart 200 million years ago, the resulting basaltic lava lasted for 600,000 years and covered more than 9 million square kilometers (3.5 million square miles).
9.7 This model can accommodate the mantle plume hypothesis and convection cells, but the plume hypothesis' complexities muddy the waters of the current standard model and would do the same with this hypothesis. And under closer examination it would seem difficult for convective currents to exist and maintain continuity in a mantle that was expanding and contracting in 3-4 million year periodicities. Increased complexity is always moderated by reduced probability. Occam's Razor favors the least number of mechanisms to accomplish the task and this hypothesis gains nothing through adding unneeded processes. The model’s simple transfer of energy through electro-thermo-kinetic relay produces causative mechanisms for any and all current phenomenon that mantle plume and even convection cell hypotheses tenuously attempt to explain.
9.71 Mid-Ocean ridges are the result of a continental break-up that forms a new oceanic crust spreading center and a future ocean basin such as with the Atlantic. The model contends that during larger solar magnetic induction periods the mantle boundary surface will be stressed and acquire tension to an increased proportion. Due to the mantle's thermoplastic nature it will tear at thermally higher, and by that weaker boundary surface area locations. These will be symmetrically located across the mantle boundary area surface in proportion to the mantle's coefficient of restitution. These areas are where mantle heat and friction during the displacement are more likely to be concentrated, under large continental structures. Additionally the friction of the differential of allowable movement in the slowly spreading, and by that stretching continental crust would produce additional divergent mechanical force on the mantle's boundary surface, further adding the formation of these large magma and thermal reservoirs. This would provide a continuous process for continental break-up and seafloor generation to the already hypothesized cycles currently studied in this paper.
9.8 This model proposes the ancient hyper thermal extinction events are simply in line with what would be expected if solar magnetic energies were high enough to produce large expansion and production of magmatic fluid that exceeded the differential of allowable movement of the crust, resulting in the expansion fracturing of the crust and lava discharges. The solar magnetic energy levels that would produce large discharges would require the mantle to expand and fracture its surface in large tears producing large volumes of hydraulic magma. The surface tension in the crust will build to critical levels until the crust fractures at its weakest point from the extreme tension. The crustal fracture would likely occur directly over a large mantle tear where the most heat and pressure would be present to weaken the crust.
The larger mantle tears take longer to re-close due to the mantle's high viscosity, and remain filled with residual magma for protracted time periods that are in proportion to the energy that created the hyperthermal event. These larger thermal expansion periods cause the mantle surface to expose the overlying crust to extreme levels of heat and pressure. As the mantle's surface radially expands beyond the crust's rate of allowable/or differential of movement the crust will fracture at its weakest point, allowing ejecting magma out of the fracture for the duration of the solar magnetic field's high energy period. These are the hyperthermal events that include the historic Siberian Traps of 250 million years ago, the Ontong Java Plateau at 125–120 million years ago and the Deccan Traps at the end of the cretaceous period 60 - 68 million years ago.
9.9 I also believe the fractures in the crust close up proportional to the thermal contraction and in that way can be controlled from a deep fissure that uses the thermal contraction of the mantle to control high pressure magma. These are reservoirs of magma that can transfer a large degree of concentrated heat energy into the crust.
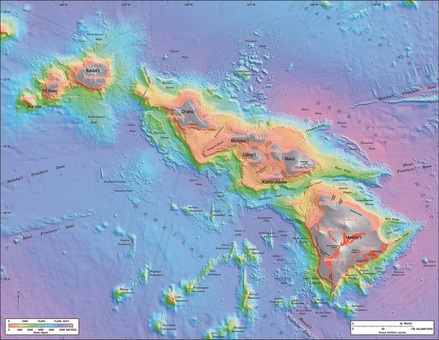
The Hawaiian and other island chains along with Yellowstone are different from ridges due to a smaller heat source in comparison to the larger scale of the volcanic activity at the mid-ocean ridge spreading centers like that of the Atlantic that are aligned to a larger magma source that allows a more passive discharge. In the most simple analogy the smaller island anomalies are high pressure leaks, due to a particular structural feature that results when a mantle tear is formed. When a thick walled spherical body of highly resilient material fails from extreme surface tension the surface will be torn in multiple places where the edges of the failures are pulled back and up as the localized tension is released. These are opened and activated only during the thermal expansion of the mantle and are slightly raised causing the crust to be stretched, thinned and cracked when positioned over these structures, exposing the crust to high levels of thermal energy. When the mantle eventually subsides causing the hotspot/mantle-tears to reform once again into the thermal plastic mantle rock as the openings close, the crust over the source simply continues at its present steady pace towards the convergent trench.
The next expansion cycle will raise the protruding mantle into the underside of the crust again causing it to break while the previously fractured, vertically stressed and laterally tensioned portion aligns to the string of past discharges now trailing beyond the magma source. The newest compromised crust section is then exposed to the high heat of the hotspot fracture's magma. As the cycle repeats the crust is continually moved towards higher temperatures until arriving over the central location. These fractures in the lower crust will slowly open and close as the cycles reoccur.
These fissures are a source of the magma that manifests through the thousands of smaller seafloor mounds and rises. I think these are fed through the untold expansion caused stress fractures that lie beneath the thick layers of ocean floor mud. Many of these lie dormant since the higher thermal event that originally fractured the crust is long over and magma has sealed the crustal fractures. These stress fractures are activated by thermal expansion that extends the crust, reopening the cracks during higher thermal periods. The magma that is delivered beneath the fractures and hotspot/tears will flow out radially under the crust, pressurizing the transitional boundary layer, rising up and supporting the crust during expansion.
10.0 The length of the thermal event (the amount of power inducted into the core) determines if the crust's stay over the hot spot is long enough to build a surface anomaly like the Yellowstone complex, an individual volcanic island, or just a short period that produces a small sea mount on the ocean floor. A series of short cooling periods interrupting an overall large thermal period would build a chain of superimposed volcanoes as the crust slowly shifted and the lava discharges intermittently continued. Eventually the Sun's magnetic energy changes and the core begins cooling and as the high heat content of the transitional boundary moves into the crust and ocean, the fissures are slowly closed causing the volcanoes to become dormant. The mantle slowly moves towards the core putting the crust into re-compression against the recent ridge infill. Depending on the timing between thermal cycles and the convergent trenches rate of resistance the crust will shift producing a proportional separation between the islands.
Images above and below courtesy of USGS
Several points to consider;
1. Previous research suggests a location in the center of large ocean basins can promote the development of large, long lasting multi cycle hotspot/mantle-tears.
2. Iceland's Hotspot's long term stationary position on the Atlantic Mid-Oceanic Ridge suggests a hotspot/mantle-tear can precede and promote the initiation of continental break-up process.
3. The Yellowstone hotspot/mantle-tear's periodic progress under the North American continent suggests this Super Volcano was probably born in the Pacific ocean basin and likely formed a volcanic Island chain that has been entirely subducted and/or accreted as the phenomena was overran by North America.
4. Yellowstone will likely proceed on to eventually assist the activity at the New Madrid Seismic Zone, also called the New Madrid Fault Line, a major seismic zone and a prolific source of intraplate earthquakes centered along the Mississippi River.
5. Nascent divergent plate boundaries are likely created in two different scenarios;
a: by catastrophic levels of mantle displacement energies in large continental/oceanic plate assemblies.
This scenario is strongly supported by; such an event occurring at the Middle America Trench (MAT).
https://www.nature.com/articles/s41561-018-0229-y.epdf?referrer_access_token=HnO4WLMkwIDAFKrrT9rJIdRgN0jAjWel9jnR3ZoTv0PCVFi5Qgnv4AZa5anaERJuXVeI0Z9Swq0ea-YUFI2LVQ8XYXvH2evpIz7y0MpjjEksanddQ6LMf6qnf09O8vVzYYHDB5EnBhO9TcYikF3eacXtCXTB4no59PlmIpW7mzk464W0k1PzII2OrWtsMKJLpT438bM9HjQCsqWDqoP98Q%3D%3D&tracking_referrer=www.nationalgeographic.com
Deep embrittlement and complete rupture of the lithosphere during the Mw 8.2 Tehuantepec earthquake
Diego Melgar 1*, Angel Ruiz-Angulo 2, Emmanuel Soliman Garcia 3, Marina Manea 4,5, Vlad. C. Manea 4,5, Xiaohua Xu 6, M. Teresa Ramirez-Herrera 7, Jorge Zavala-Hidalgo 8, Jianghui Geng 9, Nestor Corona 10, Xyoli Pérez-Campos 11, Enrique Cabral-Cano 11 and Leonardo Ramirez-Guzmán 12
"The kinematic slip model of the earth quake challenges current structural models of subduction kinematics; there is normal-faulting (extensional) rupture throughout the entire lithosphere at a point where curvature is high and through portions that should be in flexural compression, and furthermore, rupture spreads well past the 650 °C geotherm (Figs. 1d and 4) into regions where global surveys find that no normal or thrust-faulting
intraslab outer-rise-associated seismicity has ever been observed. At the nucleation depth in the bottom half of the oceanic lithosphere, the slab appears to be in tension, contrary to what is predicted from mere flexure"
"Combining these observations, we conclude that, in spite of slab curvature being high (Fig. 3a), the entire lithosphere is under wholesale deviatoric tension, explaining the unusual location of a normal-faulting mechanism in areas expected to be in compression and extending to the base of the lithosphere."
"Thus, combined seismological and geodetic observations of the 2017 Mw 8.2 Tehuantepec, Mexico, earthquake reveal that almost the entire oceanic lithosphere, including the mantle and crust, ruptured in a single large intraslab normal-fault earthquake. It is possible that the 1931 normal-faulting Mw 8.0 Oaxaca earthquake, just east of the Tehuantepec Ridge, similarly broke the entire lithosphere and that both events are part of an ongoing larger-scale breakdown of the slab; however, limited historical seismograms make that determination difficult. Here, we have shown conclusively, with a wide diversity of geophysical observations, that under the right conditions, large earthquakes can nucleate in and rupture through the entire oceanic plate, even for young subduction zones."
b: by hotspot/mantle-tear triple junction initiation and divergent boundary development that sometimes leads to island chain development.
-------------------------------------------------------------------------------------------------------------------------------------------------------
Page 25
Mechanism for
High speed
Continental movement
-----------------------------------------------------------------------------------------------------------------------------------------------------------------------------------------------------------------
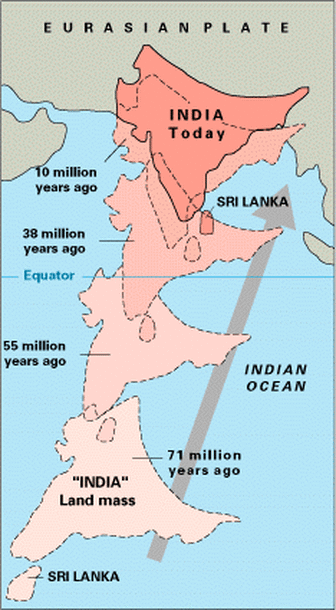
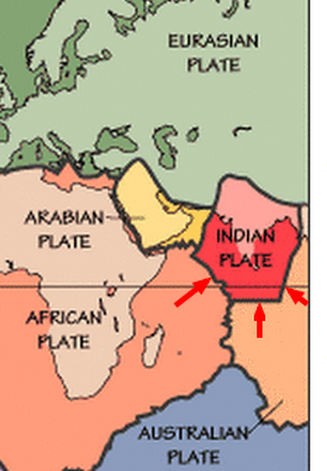
10.1 The model can provide the solution to the perplexing mystery of how the Indian continent was propelled at such a high rate of progress for nearly 75 million years. What the image at the left does not show is how the Indian continent was positioned between two much larger continental plates, the African to its west and the Australian to its east.
These two massively larger plates were in turn positioned against the edge of the even larger Antarctic plate. The boundary where these three plates contacted has a very unique shape, in mechanical engineering it would be described as a compounding mechanism.
The Indian continent's journey occurred over many core thermal cycles/mantle thermal pulses where the tectonic plates were displaced outward by the mantle as the divergent boundaries filled with magma. When the core cooled and the mantle gradually subsided, the most recent infill produced gradually increasing compression in the global plate matrix. As this compression grew the smaller plates were moved at the expense of the larger plate's masses. As the cycles repeated the Indian continent was quickly moved towards Asia.
The evidence for this would be the tell-tail acceleration-deceleration of the Indian Continent that would coincide with the timing of mantle thermal pulses;
https://www.academia.edu/38174615/Mantle_thermal_pulses_below_the_Mid_Atlantic_Ridge_and_temporal_variations_in_the_formation_of_oceanic_lithosphere
Mantle thermal pulses below the Mid-Atlantic Ridge and temporal variations in the formation of oceanic lithosphere
"A 20-Myr record of creation of oceanic lithosphere at a segment of the central Mid-Atlantic-Ridge is exposed along an uplifted sliver of lithosphere. The degree of melting of the mantle that is upwelling below the ridge, estimated from the chemistry of the exposed mantle rocks, as well as crustal thickness inferred from gravity measurements, show oscillations of ,3–4 Myr superimposed on a longer-term steady increase with time. The time lag between oscillations of mantle melting and crustal thickness indicates that the solid mantle is upwelling at an average rate of ,25mmyr, but this appears to vary through time."
So, we now need direct evidence that these cycles appear in the observational research of the Indian Continent's progress.
https://www.science.org/doi/10.1126/sciadv.aaz8681
The convergence history of India-Eurasia records multiple subduction dynamics processes
ADINA E. PUSOK HTTPS://ORCID.ORG/0000-0002-4439-8124 AND DAVE R. STEGMAN
RESULTS
"We compiled India-Eurasia convergence data from more than 30 published studies in the last 20 years that either produced new estimates or reinterpreted older data due to method improvements. We collapse the data in 58 plots, with a total of 70 unique convergence profiles. The most accurate recordings of India’s plate motion, are from shiptrack data from the Central Indian Ridge (CIR; India-Africa) and Southeast Indian Ridge (SEIR; India-Antarctica) in the Indian Ocean. The detailed features of this high-resolution data occur consistently across methods and studies. We use this extended dataset to quantify the magnitude and durations of each of the proposed stages. Convergence data show that India moved steadily northeast relative to fixed Eurasia at 80 to 90 mm/year from ∼72 to 68 Ma, when it started accelerating to 180 mm/year at ∼66 Ma. This period includes increased spreading rates in the Indian Ocean, a corresponding slowdown of Africa, and culminates in a burst of superfast spreading [up to 220 mm/year] from ∼66 to 63 Ma coincident with the time of maximum outpouring of Deccan flood basalts. The sudden drop to 120 mm/year at 63 to 62 Ma has been largely overlooked, despite being noted by some studies. From ∼62 to 50 Ma, a second period of faster spreading (up to 160 mm/year) precedes a prolonged slowdown from ∼50 to 45 Ma. The spreading azimuths at CIR and SEIR remain constant during this slowdown, until they abruptly change at ∼43 Ma, indicating further changes in plate driving forces."
It's difficult to ignore this model's repeated abilities to predict this planet's operational parameters.
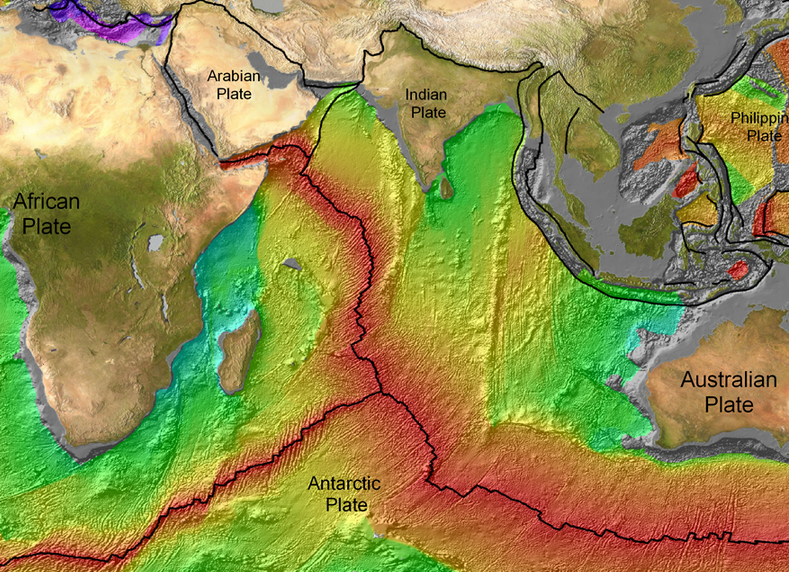
10.2 When the mass of the world's tectonic plates compressed against the African and Australian Plates it produced an increasing lateral compressive energy, India lying in between the two larger continents was compressed and moved in proportion to the release of the gravitational potential energy in the entire global plate matrix. The Antarctic plate provided the repeated cycles of compound mechanical leverage that produced a variable rate of compression, forcing a rapid northward movement in the direction of least resistance of the Indian plate. The Indian Plate was rapidly squeezed out from between the two other continents by a compound scissor action from the unique mechanical leverage between the three massive continents on the smaller Indian Plate.
Is there any evidence that the Indian continent could have been compressed between two larger continents and squeezed out from between them? Leaving the two opposing plate sections with deformities that exhibit the telltale signs that their plate edges were subjected to great pressures?
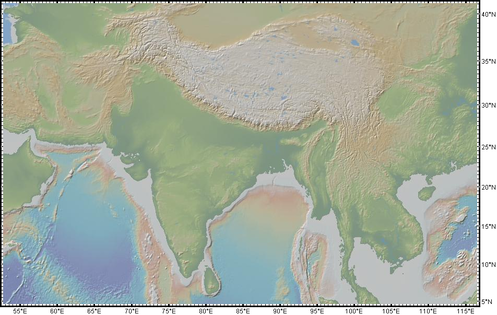
10.3 The adjacent plate sections exhibit such deformities where India appears to have traveled between them.
10.3 The adjacent plate sections exhibit such deformities where India appears to have traveled between them.
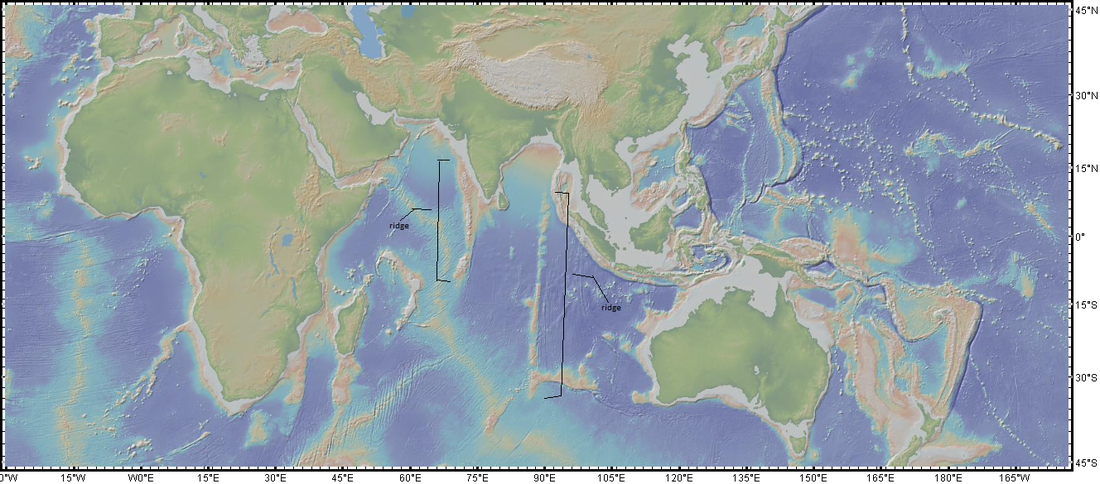
Image above was modified by this author and was furnished through and in no way endorsed by http://www.geomapapp.org using Global Multi-Resolution Topography (GMRT) Synthesis,
Ryan, W. B. F., S.M. Carbotte, J. Coplan, S. O'Hara, A. Melkonian, R. Arko, R.A. Weissel, V. Ferrini, A. Goodwillie, F. Nitsche, J. Bonczkowski, and R. Zemsky (2009), Global Multi-Resolution Topography (GMRT) synthesis data set, Geochem. Geophys. Geosyst., 10, Q03014, doi:10.1029/2008GC002332.
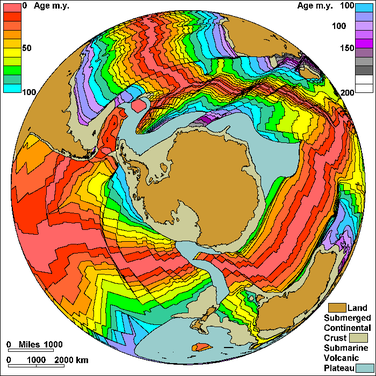
10.4 This seafloor age map below gives a more definitive idea of where the likely path was, undoubtedly between the pressure ridges. During the intervening years seafloor has been added during expansion portion of the cycle as the Indian continent was slowly forced northward by the unimaginable energy furnished by the mantle's return towards the core.
Ryan, W. B. F., S.M. Carbotte, J. Coplan, S. O'Hara, A. Melkonian, R. Arko, R.A. Weissel, V. Ferrini, A. Goodwillie, F. Nitsche, J. Bonczkowski, and R. Zemsky (2009), Global Multi-Resolution Topography (GMRT) synthesis data set, Geochem. Geophys. Geosyst., 10, Q03014, doi:10.1029/2008GC002332.
- Data doi: 10.1594/IEDA.0001000, through http://creativecommons.org/licenses/by-nc-sa/3.0/us/
10.4 This seafloor age map below gives a more definitive idea of where the likely path was, undoubtedly between the pressure ridges. During the intervening years seafloor has been added during expansion portion of the cycle as the Indian continent was slowly forced northward by the unimaginable energy furnished by the mantle's return towards the core.

Credit for images above: Mr. Elliot Lim, CIRES & NOAA/NGDC, and citation to Müller, R.D., M. Sdrolias, C. Gaina, and W.R. Roest 2008. Age, spreading rates and spreading symmetry of the world's ocean crust, Geochem. Geophys. Geosyst., 9, Q04006, doi:10.1029/2007GC001743.
-----------------------------------------------------------------------------------------------------------------
Page 26
Mechanism for
Mountain formation
-----------------------------------------------------------------------------------------------------------------------------------------------------------------------------------------------------------------
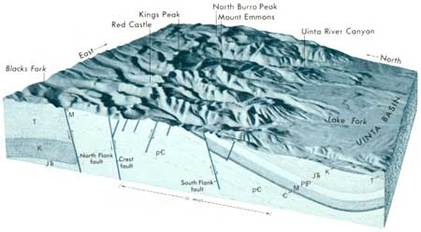
10.5 This mechanism is the long sought builder of mountain ranges around the Earth. The mystery of how and why colliding land masses don't halt but continue to move into the only unobstructed direction, skyward, beyond any theorized energy source's ability to not only produce but deliver the required traction to compress, fold, override, and raise 8.8 meters (5.5 miles) into the atmosphere a chain of mountains has gone until now unanswered in current plate dynamics theories. But because all of the Earth’s divergent plate boundaries find magma infill simultaneously, the tectonic plates are all preloaded together creating a continuous unmovable foundation for the tectonic plates to convert their mass weight from vertical gravitational energy to horizontal kinetic energy to move the plates in the path of least resistance whether it be an oceanic plate subducting, a continental plate overriding another, or the mass collision of rock driven vertically into a mountain range.
Image left; Geologic cross section through the Western Uinta Mountains. pC Precambrian rocks; C, Cambrian; M, Mississippian; PP, Permian and Pennsylvanian; JTr, Jurassic and Triassic; K, Cretaceous; T, Tertiary. Courtesy USGS
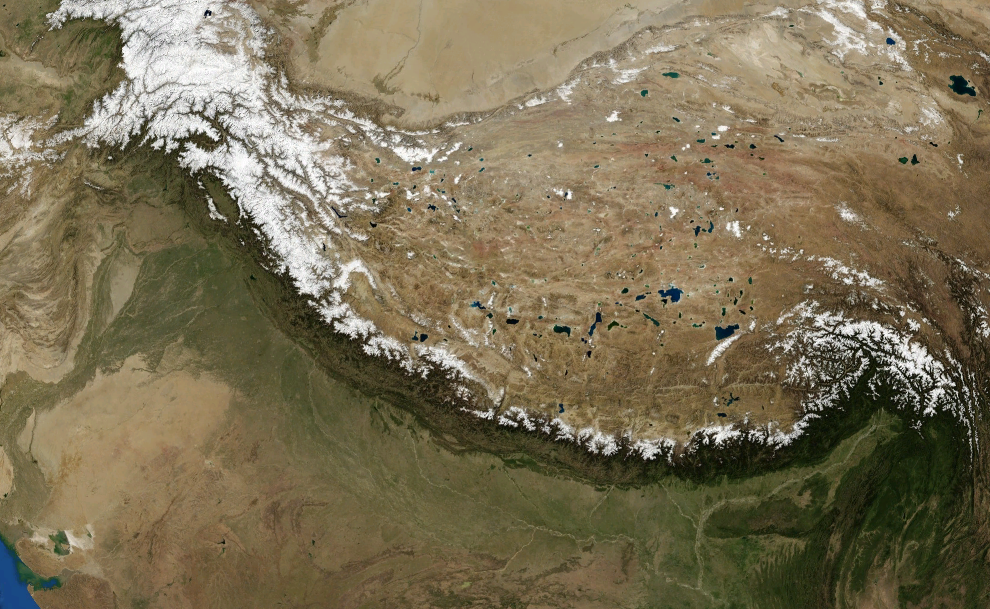
Image below courtesy NASA Ames Research Center, World Wind. Himalayas as pictured by NASA Landsat 7 Satellite.
10.6
The current observable evidence is that there is compression in the crust that is derived from and in the form of gravitational potential energy.
http://ceas.iisc.ern...h_geology06.pdf
Gravitational potential energy of the Tibetan Plateau and the forces driving the Indian plate
Attreyee Ghosh, William E. Holt
Department of Geosciences, State University of New York, Stony Brook, New York 11790, USA
Lucy M. Flesch*
Department of Terrestrial Magnetism, Carnegie Institution of Washington, Washington, DC 20015, USA
A. John Haines†
Bullard Laboratories, University of Cambridge, Cambridge CB3 0EZ, UK
ABSTRACT
"We present a study of the vertically integrated deviatoric stress field for the Indian plate and the Tibetan Plateau associated with gravitational potential energy (GPE) differences. Although the driving forces for the Indian plate have been attributed solely to the mid-oceanic ridges that surround the entire southern boundary of the plate, previous estimates of vertically integrated stress magnitudes of 6–7 1012 N/m in Tibet far exceed those of 3 1012 N/m associated with GPE at mid-oceanic ridges, calling for an additional force to satisfy the stress magnitudes in Tibet. We use the Crust 2.0 data set to infer gravitational potential energy differences in the lithosphere. We then apply the thin sheet approach in order to obtain a global solution of vertically integrated deviatoric stresses associated only with GPE differences. Our results show large N-S extensional deviatoric stresses in Tibet that the ridge-push force fails to cancel."
. . . ."there is no complete dynamic explanation for this large GPE of the Tibetan Plateau and the relatively fast movement of the Indian plate. There is no apparent down going slab attached to the Indian plate that might assist in driving the plate into Eurasia through the slab pull mechanism" . . . . .
. . . . "However, the ridge push, or vertically integrated deviatoric stress magnitude, which is 3 1012 N/m (Richardson, 1992; Harper, 1975; Lister; 1975; Parsons and Richter, 1980), is not sufficient to satisfy inferred stress magnitudes of 6–7 1012 N/m that result from GPE differences between the Tibetan Plateau and the surrounding lowlands (Molnar and Lyon-Caen, 1988). An additional force is required to explain the disparity between the excess GPE of Tibet relative to that of the mid-oceanic ridges" . . . .
. . . ."Lithospheric density variations associated with the support of the high topography of the Tibetan Plateau give rise to lithospheric body forces and hence stresses. Although the sources of stress that drive plate motions have been ascribed to many parameters (Forsyth and Uyeda, 1975), from the point of view of stress continuity and force balance, the stresses that drive lithospheric motion arise from two sources: (1) gravity acting on density variations within the lithospheric shell on Earth, and (2) gravity acting on density variations deeper than the lithospheric shell. The latter gives rise to tractions (radial and tangential) that act on the base of the lithosphere, affecting the stress field of the lithosphere and producing dynamic topography.The former involves density variations associated with support of nondynamic components of topography".
Conclusions;
. . "It is clear that something is missing as a driving force that does not have its source within the lithospheric shell."
10.7 To understand how a continental plate of the modest size of the Indian plate could acquire the traction forces to raise a mountain system the height of the Himalayas one has only to look at its relationship to the surrounding tectonic plates. The Indian plate’s edges along its southern half reveal an important factor to this geologic battering ram. The two outside southern edges are angular to the southern edge’s almost latitudinal alignment. These facets are locked into the matrix of the African and Australian tectonic plates.
The mass of these two continents along with the Antarctic plate, when converted to horizontal kinetic energy, press against the magma infill of their respective divergent plate boundaries and are moved with respect to their mid-ocean rift thrust points, the Atlantic Rift to the West, the Antarctic Rift to the South and the Australian to the East, crushing India against the equally massive Eurasian plate to the North.
The mass of these two continents along with the Antarctic plate, when converted to horizontal kinetic energy, press against the magma infill of their respective divergent plate boundaries and are moved with respect to their mid-ocean rift thrust points, the Atlantic Rift to the West, the Antarctic Rift to the South and the Australian to the East, crushing India against the equally massive Eurasian plate to the North.
10.8 The African and Australian continental plates are moving to the northeast. The Indian plate lies at the pinch point of these two powerful traction engines. Their combined gravitationally driven lateral forces being concentrated into the comparative narrow area of convergence of the two continental plates propels India like a prow of trireme into the side of Asia.
The African and Australian plate's Northern convergent zones have outside of this convergence with India, mostly subducting or fault slip oceanic/continental shelf that has appreciably less resistance allowing a geologically continuous mechanical advancement.
Image above was furnished through and in no way endorsed by http://www.geomapapp.org using Global Multi-Resolution Topography (GMRT) Synthesis,
Ryan, W. B. F., S.M. Carbotte, J. Coplan, S. O'Hara, A. Melkonian, R. Arko, R.A. Weissel, V. Ferrini, A. Goodwillie, F. Nitsche, J. Bonczkowski, and R. Zemsky (2009), Global Multi-Resolution Topography (GMRT) synthesis data set, Geochem. Geophys. Geosyst., 10, Q03014, doi:10.1029/2008GC002332.
- Data doi: 10.1594/IEDA.0001000, through http://creativecommons.org/licenses/by-nc-sa/3.0/us/
10.9
I was studying some controversy in regards to mountain formation. There is a great paper that outlines the theory that proposes a more recent and defined era of rapid mountain building on a global scale.
ANNALS OF GEOPHYSICS, SUPPLEMENT TO VOL. 49, N. 1, 2006
Mountain uplift and the Neotectonic Period
CLIFF D. OLLIER
School of Earth and Geographical Sciences, University of Western Australia, Perth, Australia
9.2. EXAMPLES
9.2.1. Tibet, Himalayas, Kunlun Mountains
(As an example, consider the timing of uplift in Tibet and its bordering mountains. Gansser (1991) wrote: «... we must realize that the morphogenic phase is not only restricted to the Himalayas but involves the whole Tibetan block. This surprising fact shows that an area of 2500000 km2 has been uplifted 3000-4000 m during Pleistocene time and that this uplift is still going on.» In places the uplift rate is 4.5 mm/yr (five times the maximum in the European Alps). According to Wu et al. (2001) from the Pliocene to the Early Quaternary (5-1.1 Million years) the Kunlun Pass area of the Tibetan Plateau was no more than 1500 m high and was warm and humid. They write: «The extreme geomorphic changes in the Kunlun Pass area reflect an abrupt uplift of the Tibet Plateau during the Early and Middle Pleistocene. The Kunlun-Yellow River tectonic movement occurred 1.1-0.6 Million years.» Zheng et al. (2000) concluded from sediments at the foot of the Kunlun Mountains that uplift began around 4.5 Million years.)
9.4. CONCLUSIONS
(Mountains are created by the vertical uplift of former plains, independent of any folding of the rocks underneath. The age of mountains should therefore refer to the age of vertical uplift after planation, not to the last period of folding (if the underlying bedrock happens to be folded). Most uplift occurred in the Plio-Pleistocene, or the very Late Miocene. The Neotectonic Period is demonstrated by the large amount of work listed in table 9.I. Plate tectonics, the ruling theory of the past forty years, has no adequate explanation for the widespread planation in mountain regions, or the remarkably young uplift. Indeed it is based on an association of folding and uplift that is demonstrably untrue. Plate tectonics has no plausible explanation for mountains on passive margins or continental interiors. From now on it is incumbent on those who propose models of mountain formation to do two things: Incorporate planation surfaces into the story (or prove there was no former planation). – Either disprove the Neotectonic Period hypothesis, or show how their proposed mechanisms fit into the time scale of just a few million years). . . . .(Uplift occurred over a relatively short and distinct time. Some unknown process created mountains after a period with little or no significant uplift. This is a deviation from uniformitarianism. The mountain building period is relatively short, and not on the same time scale as granite intrusion (which takes tens of millions of years), or plate tectonics which is supposedly continuous over hundreds of millions of years. The same rapid uplift occurs in areas where hypotheses such as mantle plumes are not appropriate. We do not yet know what causes this short, sharp period of uplift, but we can exclude naive mountain-building hypotheses that are on the wrong time scale.) . . .(One of the biggest obstacles to our hypothesis of widespread Plio-Pleistocene mountain building is that the period of time available for the preceding planation is too short. Only further investigation can clarify this point.)
11.0 The variability of the mantle thermal pulses can answer this challenge. I believe long and short durational periods of high magnetic field induction have driven various geologic events, the breakup of Pangaea and the subsequent 600 thousand year cataclysmic volcanic event for one. I want to check another source.
http://pubs.usgs.gov/gip/dynamic/himalaya.html
The collision of India into Asia 50 million years ago caused the Indian and Eurasian Plates to crumple up along the collision zone. After the collision, the slow continuous convergence of these two plates over millions of years pushed up the Himalayas and the Tibetan Plateau to their present heights. Most of this growth occurred during the past 10 million years. The Himalayas, towering as high as 8,854 m above sea level, form the highest continental mountains in the world. Moreover, the neighboring Tibetan Plateau, at an average elevation of about 4,600 m, is higher than all the peaks in the Alps except for Mont Blanc and Monte Rosa, and is well above the summits of most mountains in the United States. . . . The Himalayas and the Tibetan Plateau to the north have risen very rapidly. In just 50 million years, peaks such as Mt. Everest have risen to heights of more than 9 km. The impinging of the two landmasses has yet to end. The Himalayas continue to rise more than 1 cm a year -- a growth rate of 10 km in a million years! If that is so, why aren't the Himalayas even higher? Scientists believe that the Eurasian Plate may now be stretching out rather than thrusting up, and such stretching would result in some subsidence due to gravity.
11.1 This sudden mountain building energy and era is seen in the South American Andes as well;
http://www.rochester...n-in-the-andes/
“This study provides increasing evidence that the plateau formed through periodic rapid pulses, not through a continuous, gradual uplift of the surface, as was traditionally thought,” said Garzione. “In geologic terms, rapid means rising one kilometer or more over several millions of years, which is very impressive.”
“What we are learning is that the Altiplano plateau formed by pulses of rapid surface uplift over several million years, separated by long periods (several tens of million years) of stable elevations,” said Garzione.
11.2
http://www.rochester.edu/news/show.php?id=3167
“Tectonic Theory May Need Revision in Light of New Study in Science”
“Mountains may experience a "growth spurt" that can double their heights in as little as two to four million years—several times faster than the prevailing tectonic theory suggests.”
“By studying sedimentary basins in the high Andes Mountains, the team could determine when and at what altitude these ancient sediments were deposited. That record of altitude changes shows that the Andes Mountains rose slowly for tens of millions of years, but then suddenly lifted much faster between 10 and 6 million years ago.”
11.3 Stunning isn't it. The two youngest and largest ranges by way of their own metrics occurred simultaneously. Here we have not one but two examples of massive energy dispositions in a geologic blink of an eye in opposite hemispheres at the same time. And the standard model would prescribe two different causes no doubt despite the rather devastating evidence regarding the conclusion earlier;
http://pubs.usgs.gov...c/himalaya.html
"It is clear that something is missing as a driving force that does not have its source within the lithospheric shell."
The time period is short, again, geologically in a blink of an eye. If their hypothesis is correct the mountain building periods have occurred repeatedly over the Earth's history. These mountains are surely not a onetime phenomena. But the periods in between have to be long enough to allow the former to erode substantially.
11.4 The mechanical advancement of Indian plate in this model has the required energy to raise and hold the Tibetan Plateau. The model has the Sun in an extended magnetic field energy period. As the thermal expansion cycle begins, the mantle's slow release of hydraulic magma presses out the Earth’s crust and all divergent plate boundaries open and receive magma infill. This period of high magnetic energy will slowly raise the core temperature, causing the slow and gradual displacement of the crust and mantle. The extensional processes will produce the planation through the resistance to allowable movement by the heavier sections of crust. This frictional drag stretches the lithosphere and extends upper crust, lowering the surface layers into the thinning substrate. The expansion period is long (2-3 million + years) and mostly in one direction (expansion) with a few lapses in solar magnetic energy that would allow cooling in the crust/mantle boundary and short episodes of increased movement and earthquakes in the subduction zones of the crust.
The unusually long period of expansion has now ended, but it has raised the billion trillion ton core's temperature a substantial amount and now as that heat dissipates the cycle then switches to the thermal contraction phase when the crust/mantle boundary begins to cool. All the Earth's tectonic plates are then put into compression against the new magma infill and convert their vertical potential energy through gravitational force into the kinetic path of least resistance. As these cycles repeat they will either add gradually increasing or decreasing Gravitational Potential Energy content into the crust depending on the overall net plus gain or loss of ridge infill.
11.5 The Indian-Asian convergence has the highest compression interplate contact per kilometer on the planet. As the plateau section rises the tremendous preloaded compression that had been compiling as mass for millions of years in the Indian and Asian plates, and all other plates for that matter, presses the Indian plate continuously forward, forcing boundary area materials in under the raised plateau. The reason why the preloaded compression in the plates does not dissipate suddenly is that the source of India's advancement is thousands of kilometers away in the southern hemisphere where the Atlantic Rift to the West and the Antarctic Rift to the South, produce through millions of years’ worth of ridge infill, most of the kinetic energy that propels the Indian plate into the Asian plate. The release of this stored gravitational potential energy as compressive energy in my model fits "the time scale of just a few million years" requirement of the hypothesis.
In the image at left you can see that the Antarctic continent is completely surrounded by divergent boundaries that have produced the periodic reloading of compression as the thermal cycles have repeated. This has maintained a continual supply of compression in much of the planet's oceanic crust.
http://www-geodyn.mit.edu/zubersite/pdfs/Zuber_92JGR1987.pdf
MARIA T. ZUBER
Department of Geological Sciences, Brown University, Providence, Rhode Island
"As most of the oceanic lithosphere is in a state of net compression, the question arises as to why intraplate deformation has developed in these regions and not in others."
Image at left furnished through and in no way endorsed by; https://www.uwgb.edu/dutchs/GeolColBk/AntarcticSFS.HTM
The models ability to raise the global tectonic plate matrix while shoring the retreating divergent plate boundaries with new magma provides a means where the initial thermal expansion energy can be stored in the now increasingly compressed and increasingly raised mass of the crust as (short term) gravitational potential energy then slowly released as kinetic energy as the plates melt into the asthenosphere. Periods of excessive gravitational potential energy, the periods that exceed the trenches rates of resistance will produce (long term) storage of the kinetic energy as mass in mountain complexes.
--------------------------------------------------------------------------------------------------------------------------------------------------------------------------
Page 27
Model for the creation, storage and distribution of:
Compression and Gravitational Potential Energy
Within the crust
------------------------------------------------------------------------------------------------------------------------------------------------------------------------------------------------------------------
11.6 The solar magnetic field variability has a direct influence on the Earth’s magnetic field generator's output and the heat created in the core from the increase in current flow as the field cycles up in strength. This variability is what delivers an expansion (displacement) cycle into the Earth’s mantle that in turn drives the plate tectonic mechanism. This energy is converted, by gravitational force acting on the crust’s mass, from vertical to horizontal movement by the magma infill at the mid-ocean ridge. The potential energy in the crust can be moderated by the subduction process.
In the heat cycle there are several variables to consider, one is the amount of outer core thermal expansion energy that can be delivered to the mantle in the form of mechanical expansion (displacement). How much can the mantle be displaced in one cycle? Another is how variable is the timing between expansion periods and the degree to which the mantle subsides between them, this determines how much gravitational potential energy can be realized in the crust. How much will the crust store and how much of that energy will it release between cycles?
https://www.academia.edu/38174615/Mantle_thermal_pulses_below_the_Mid_Atlantic_Ridge_and_temporal_variations_in_the_formation_of_oceanic_lithosphere
Mantle thermal pulses below the Mid-Atlantic Ridge and temporal variations in the formation of oceanic lithosphere
"A 20-Myr record of creation of oceanic lithosphere at a segment of the central Mid-Atlantic-Ridge is exposed along an uplifted
sliver of lithosphere. The degree of melting of the mantle that is upwelling below the ridge, estimated from the chemistry of
the exposed mantle rocks, as well as crustal thickness inferred from gravity measurements, show oscillations of ,3–4 Myr
superimposed on a longer-term steady increase with time. The time lag between oscillations of mantle melting and crustal
thickness indicates that the solid mantle is upwelling at an average rate of ,25mmyr, but this appears to vary through time."
11.7 These factors determine whether the crust will build up a net plus of compressive energy. The subduction of the crust may take longer than it took the ridge to produce it. Since subduction requires the plate to be driven into the substrate continually, the core temperature decrease that initiated the increase in subduction is now the moderator of its decline. The lower the mantle temperature the slower the crust will move into the convergent boundary. The compression will build in proportion to the temperature decrease and mantle contraction while the duration of compression will be extended by the resistance of the cooler convergent boundary.
The compressive energy can be stored and then delivered in a geologically fast period of time because the subduction rate lags behind the contraction of the mantle. During increasing solar magnetic field energy, the crust is continually pressed out to allow more infill of magma that in turn creates more future potential compression during the later contraction. This is the mechanism that the before mentioned paper alludes to. “Either disprove the Neotectonic Period hypothesis, or show how their proposed mechanisms fit into the time scale of just a few million years”. The degree and time span of the solar magnetic energy is directly proportionate to the amount of potential gravitational driven kinetic energy stored in the crust.
11.8 The model's mechanism can operate, due to low solar magnetic energy, at a rate of slow and very low kinetic energy plate movement. The small movement in the crust from the cooler mantle cycles allows only small infills of magma which produce very small horizontal movement. The lowest thermal cycles may even be lower than the subduction trench's lowest rate of resistance.
The compressive energy of the global plate matrix during these periods cannot produce any mountain systems. Any compressive plate load would easily bleed into the convergent plate boundaries before any continent to continent collisions would even dent each other. Compare this example to the mountain building period. The tectonic plates are expanded and there boundaries infilled with magma, building a future compression surplus, increasing the potential kinetic energy beyond the subduction trenches rates of resistance. During the contraction phase the trenches begin to resist any further increase in plate subduction.
As the compressive energy slowly builds in the crust from the cooling core and receding mantle the continental inter-plate zones like the Himalayas receive a continual buildup of compression. At some point the subduction trenches' resistance to the compression causes a sudden direction of force change in the subducting plate, it moves in the direction of least resistance, upwards raising the overriding land mass in a geologically fast period of time. The rise is probably faster at the beginning from the initial release of compressive energy to the vertical direction. The rise is only the precursor to what will be a geologically rapid (less than 2 million years) direction of force change in the hyper-compressed substrate of the plate's rock strata resulting in vertical rupture and folding of the plate. This folding is rapid due to the large amount of potential kinetic energy still unloading from the plate matrix. This variable in plate dynamics will undoubtedly require a reexamination of geological timelines based on ridge infill / sea floor spreading.
12.0 There have been questions raised that the trenches could not receive the volume of crust produced. But the volume of the subduction is determined by the GPE stored in the raised crust, the trenches rate of resistance and the length of the contraction period, all of which happens long after the mantle has stopped expanding (displacing) and time will be the mediator to the processes that determine the ocean plate’s creation and its eventual destruction.
12.1 I believe the crust and mantle have been in a expansion mode almost the entire interglacial. And when the surface of the mantle starts to contract and then the ocean begins to cool and the crust changes from this current period where there is high levels of solar magnetic energy and divergent boundary movement to when there are lower levels of magnetic energy, and the crust is acquiring even more compression with much less or even possibly not any divergent movement, and as the trenches begin to receive what will be a long period of increased compressional energy in the crust, the next glacial will be under way.
12.2 The glacial periods last approximately 100,000 years and are likely to see increased mantle driven contraction. The million + years worth of gravitational potential energy stored in the crust will overlap the glacial and slowly produce or simply increase compression into the trenches throughout these transient thermal periods.
At these time scales there is just the disposition of heat or the lack there of. During these periods any solar magnetic levels that resulted in thermal expansion in the core would manifest as small temperature gains in the crust/mantle boundary as the mantle's surface is forced to decompress by mechanical expansion, resulting in a temperature gain as ocean water thermally warms as the boundary displacement is activated from below, similar to what is currently being observed taking place at this time at the West Antarctic Rift System that has slowly but steadily reactivated since at least the last decade of the last century.
https://en.wikipedia.org/wiki/West_Antarctic_Rift_System
https://phys.org/news/2014-06-major-west-antarctic-glacier-geothermal.html
1. Researchers find major West Antarctic glacier melting from geothermal sources
"According to his findings, the minimum average geothermal heat flow beneath Thwaites Glacier is about 100 milliwatts per square meter, with hotspots over 200 milliwatts per square meter. For comparison, the average heat flow of the Earth's continents is less than 65 milliwatts per square meter."
https://www.nsf.gov/news/news_summ.jsp?cntn_id=295861&org=NSF&from=news
2. Previously unsuspected volcanic activity confirmed under West Antarctic Ice Sheet at Pine Island Glacier
""Our finding of a substantial heat source beneath a major WAIS glacier highlights the need to understand subglacial volcanism, its interaction with the marine margins and its potential role in the future stability of the WAIS,” they write in the Nature Communications article.""
"They also note that volcanic activity could be increasing the rate of collapse of the Thwaites Glacier, which is adjacent to the Pine Island Glacier.''
"A complete collapse of the Thwaites Glacier could significantly affect global sea levels, according to scientists. The Thwaites already drains an area roughly the size of the state of Florida, accounting for about 4 percent of global sea level rise -- an amount that has doubled since the mid-1990s."
https://sp.lyellcollection.org/content/specpubgsl/early/2017/05/26/SP461.7.full.pdf
3. A new volcanic province: an inventory of subglacial volcanoes in West Antarctica
"West Antarctica hosts one of the most extensive regions of stretched continental crust on the Earth, comparable in dimensions and setting to the East African Rift System and the western USA’s Basin and Range Province"
https://pubs.geoscienceworld.org/gsa/geosphere/article/14/6/2407/565649/Geodynamic-models-of-the-West-Antarctic-Rift
4. Geodynamic models of the West Antarctic Rift System: Implications for the mantle thermal state
https://agupubs.onlinelibrary.wiley.com/doi/pdf/10.1002/2017GL075609
5. Heat Flux Distribution of Antarctica Unveiled
https://www.theguardian.com/world/2017/aug/12/scientists-discover-91-volcanos-antarctica
6. Scientists discover 91 volcanoes below Antarctic ice sheet
"After the team had collated the results, it reported a staggering 91 previously unknown volcanoes, adding to the 47 others that had been discovered over the previous century of exploring the region."
"The project, by Edinburgh University researchers, has revealed almost 100 volcanoes – with the highest as tall as the Eiger, which stands at almost 4,000 metres in Switzerland."
"Geologists say this huge region is likely to dwarf that of east Africa’s volcanic ridge, currently rated the densest concentration of volcanoes in the world."
It is quite significant that this sudden increased activation of the planet's largest active volcanic province containing the planet's largest active rifting zone has occurred simultaneously with the climate change phenomenon.
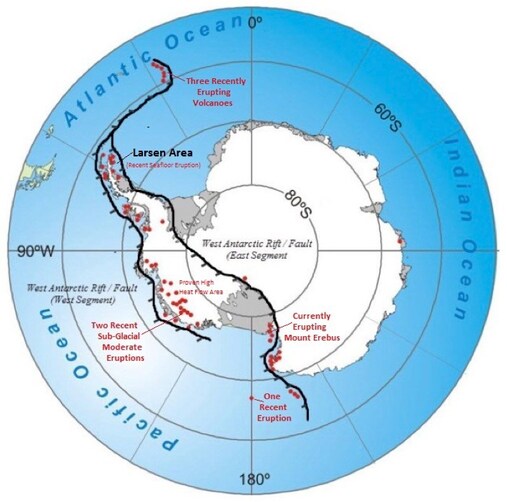
This small amount of heat flux seen in the papers above would probably not cause a significant reduction of the present compression that has resided in the crust since that major solar magnetic energy reduction period that initiated the current ice age that began 2.6 million years ago. I believe this present global activity in Antarctica, and all other divergent boundaries, is just one of many small pulse increases connected to the current increase period of solar magnetic flux that began at the end of The Little Ice Age that has furnished a primarily positive heat gain content in the upper mantle, producing little more than a subtle relieving but not ending to the compression that has been redistributing in the crust and eventually into the convergent boundaries over the previous 2.6+ million years.
12.3 "Primarily" is referring to the variability in this phenomena, the thermal component is a constant variable. Even though the mantle is slowly moving out during an overall period of an outward oscillation phase that lasts for several million years, there would be short and longer pulses repeatedly for hundreds of thousands of years, it would have continuous variability in core temperature influencing its rate and temperature. It may cool slightly and slow periodically for periods of varying lengths.
The Little Ice Age for example, would be the most likely effect of a cooling of this nature. Another possible response to mantle cooling is the Younger Dryas stadial, sometimes called the Big Freeze; it was a geologically brief (1,300 ± 70 years) period of cold climatic conditions that occurred between approximately 12,800 and 11,500 years before present.
Data from Greenland ice core GISP2 indicate that Greenland was approximately 15 °C (27.0 °F) 59° colder during the Younger Dryas than today - (Alley, Richard B. et al. (1993). "Abrupt accumulation increase at the Younger Dryas termination in the GISP2 ice core". Nature 362) (6420): 527–529.
Nothing of the size, extent, or rapidity of this period of abrupt climate change has been experienced since. - (Alley, Richard B. (2000). "The Younger Dryas cold interval as viewed from central Greenland". Quaternary Science Reviews 19 (1): 213–226.)
12.4 The mountain building period mentioned above began just before the current 2.58 million year long ice age period. It seems the mountain building period was concurrent with cooler climate periods. Any time before an ice age is warmer but I would expect a period that has mountain building to have a long period of higher core temperatures before it. While periods of higher compressive plate energies would be expected to extend into the midst of a glacial period. This increase of compression may account for some Island Arc volcanism near the trenches during these colder periods as the plates continue to unload large inventories of gravitational potential energy. For example; Lake Toba supervolcano erupted 75,000 years before present, causing a volcanic winter that pushed some species including humans to the brink of extinction.
-------------------------------------------------------------------------------------------------------------------------------------------------------
Page 28
Model for globally simultaneous boundary deformation
with subsequent and significant
carbon isotope excursions and
Mass extinctions (Evolutionary Mechanism)
--------------------------------------------------------------------------------------------------------------------------------------------------------------------------------------------------------------------------------------------------------------------------------
16.1 This model proposes that all tectonic boundaries are simultaneously loaded with compression derived from the gravitational potential energy produced by the mantle’s periodic subsidence. And that the boundaries current physical configurations belie their disposition of, and response to, the highest levels of GPE present during those periods that are geographically and temporally simultaneous.
The Himalayan and Andean ranges have been shown to be geologically synchronous in origin and that their source and timing are both dependent on the same mechanism this model proposes. This source’s simple surface mechanics that explain so well the origin of these ranges must also impose itself on all other boundaries to proportionate degrees.
16.2 These boundaries must include the divergent Mid Ocean Ridges as well. Taking into account their own and very unique geologic circumstances they should tell the story of their physical arrangement and place within the reference frame of the Plio-Pleistocene Mountain building era as proposed by Dr. Ollier and others.
The oceanic plates in question, the Pacific and Atlantic, can be analyzed using this model to reveal their responses to the energies disposed onto them, revealing the exact nature of the mountain building event in a global scale reference frame.
The image below is a typical Pacific Mid Ocean Ridge cross section taken west of Ecuador. Please note the base width is approximately 25-26 km or around 16 miles and the height is 500 m. or 1640 ft.

Images and cross sections above and those below were furnished through and in no way endorsed by http://www.geomapapp.org using Global Multi-Resolution Topography (GMRT) Synthesis,
Ryan, W. B. F., S.M. Carbotte, J. Coplan, S. O'Hara, A. Melkonian, R. Arko, R.A. Weissel, V. Ferrini, A. Goodwillie, F. Nitsche, J. Bonczkowski, and R. Zemsky (2009), Global Multi-Resolution Topography (GMRT) synthesis data set, Geochem. Geophys. Geosyst., 10, Q03014, doi:10.1029/2008GC002332.
Data doi: 10.1594/IEDA.0001000, through http://creativecommons.org/licenses/by-nc-sa/3.0/us/
16.3 Compare the Pacific MOR above to this one below of a typical Atlantic cross section.
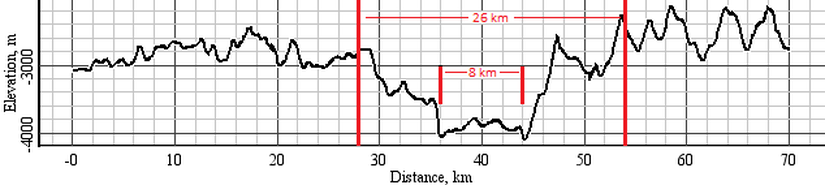
16.4 The 26 km Pacific MOR is dwarfed by its Atlantic counterpart, the Atlantic’s spreading center at this location is typical of the entire range in that it resembles a proto basin, here it is over 8 km wide. Below is a 140 km wide Atlantic cross section image.
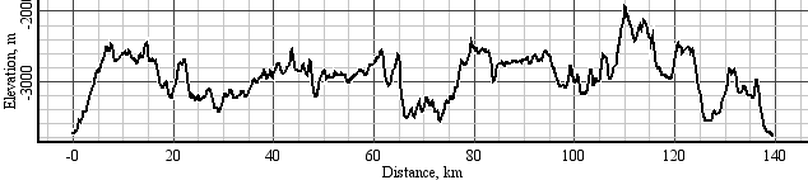
16.5 And now a 280 km cross section image.
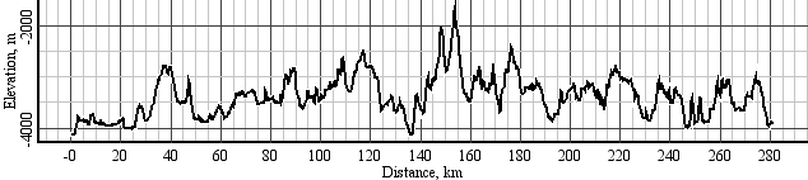
16.6 And finally at 550 km image, notice also it rises 2400 m., or 1.5 miles, as compared to the Pacific MOR at its much lower 500 m.
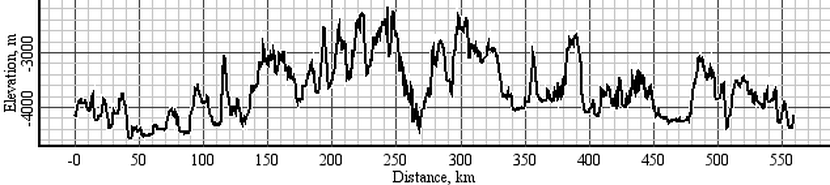
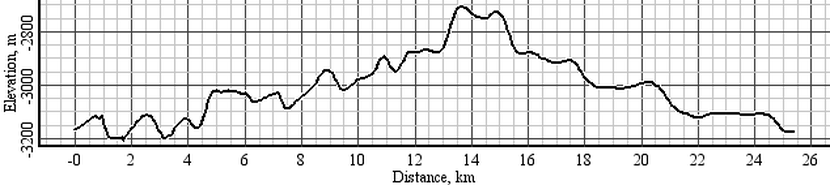
16.7 It is remarkable how physically different these two boundaries appear in these cross sections. The spreading center of the Pacific MOR is diminutive against the Atlantic’s.
Now let’s look at an overhead view of these two spreading centers, first the Pacific.
Now let’s look at an overhead view of these two spreading centers, first the Pacific.
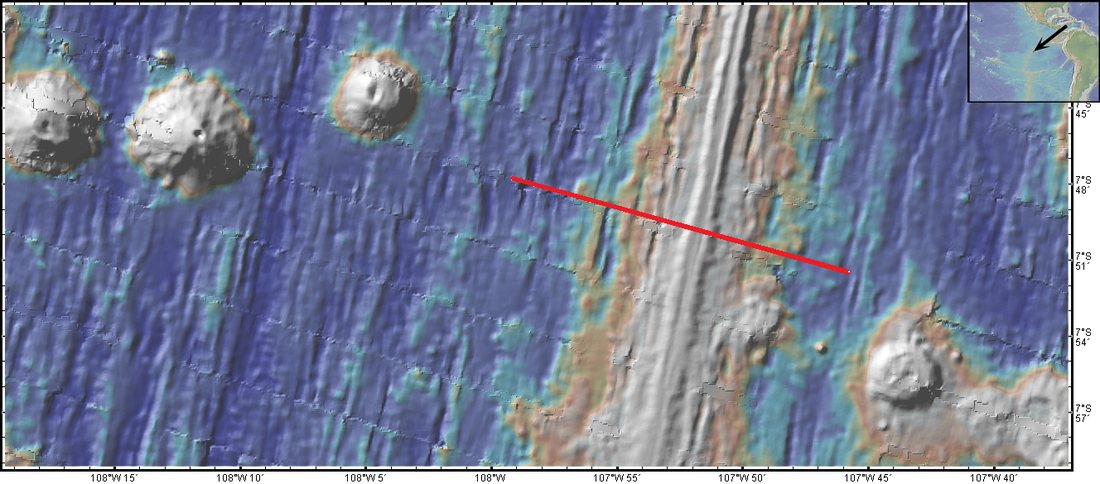
16.8 That red line is the location of the 26 km cross section seen immediately above this image. This image is a total of 70 kilometers across. Below, the Atlantic MOR image is also shown at 70 km. across.
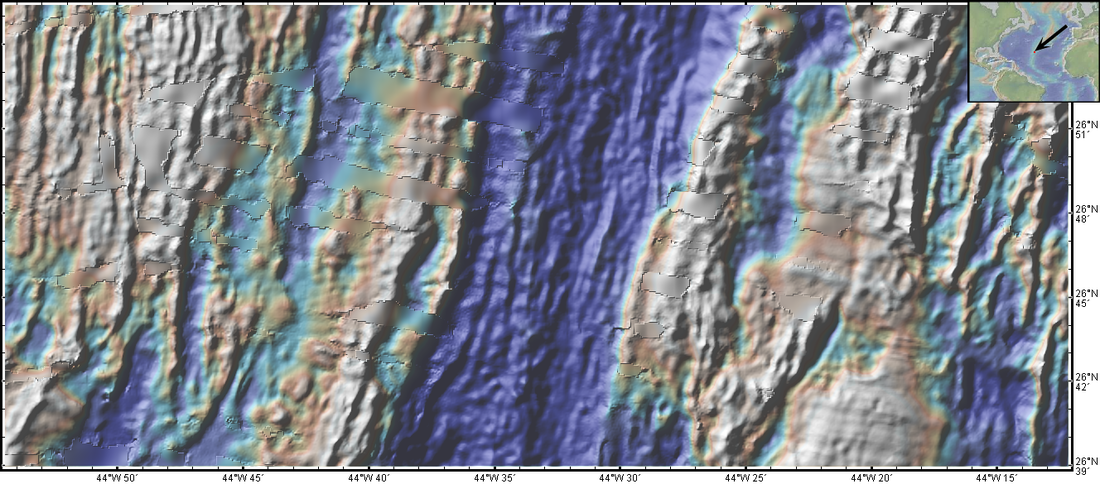
16.8 And below a 70 km. cross section of the same area.

16.9 Why are these two Mid Ocean Ridge sections so different? Or more to the point, why is the Atlantic MAR so completely different than all of the others around the globe?
The standard model explains that this is due to the mantle under the Atlantic ridge having higher temperatures, and by that lower densities, leading to the formation of a bulge at the mantle surface area directly below the ridge, and this has led to the crust above to be formed at a higher topography than the adjacent and presumed cooler mantle areas to either side.
This is typical of the standard model, each phenomena has a custom rendered thermal dependent answer based on an upward convective force of one type or another.
17.0 This model can reconstruct the circumstances leading up to this phenomena and show it is simply the result of its current position within its own developmental timeline.
This model proposes the elevation of the Mid Atlantic Ridge, or MAR, is the result of the Pleo-Pleistocene mountain building era and can be shown to fit perfectly to that timeline and the surface mechanics that this model confidently exhibits for those and other geologic phenomena.
We can start this examination by looking at the paper by Dr. Ollier again;
ANNALS OF GEOPHYSICS, SUPPLEMENT TO VOL. 49, N. 1, 2006
Mountain uplift and the Neotectonic Period
CLIFF D. OLLIER
School of Earth and Geographical Sciences, University of Western Australia, Perth, Australia
9.2. EXAMPLES
9.2.1. Tibet, Himalayas, Kunlun Mountains
“According to Wu et al. (2001) from the Pliocene to the Early Quaternary (5-1.1 Million years) the Kunlun Pass area of the Tibetan Plateau was no more than 1500 m high and was warm and humid. They write: «The extreme geomorphic changes in the Kunlun Pass area reflect an abrupt uplift of the Tibet Plateau during the Early and Middle Pleistocene. The Kunlun-Yellow River tectonic movement occurred 1.1-0.6 Million years.» Zheng et al. (2000) concluded from sediments at the foot of the Kunlun Mountains that uplift began around 4.5 Million years.”
Uplift began at 4.5 MYA.
17.1 Below are some additional cross sections along the Atlantic ridge like those shown above. And taking into consideration that their data has also been laterally compacted and the actual basin that is developing between the ridges is much wider than shown. For example in the image below the ridge on the right is over 2 km high while the spreading center basin that lies between the ridges is around 9 km wide. The basin therefore would need to be shown as being more than 4 times wider to be in proper scale to the ridge elevation. This model proposes that before the Pleo-Pleistocene the Atlantic boundary exhibited much lower elevations, ones closer to those of the Pacific MOR.
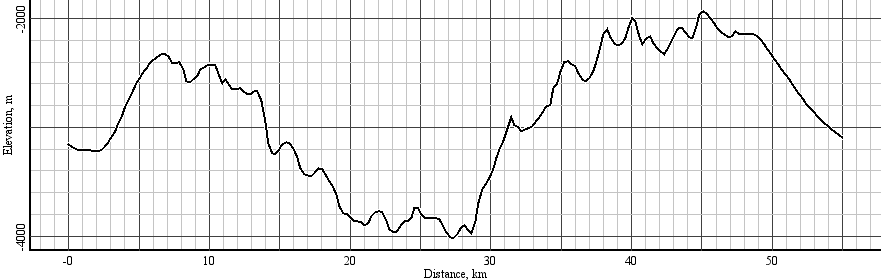
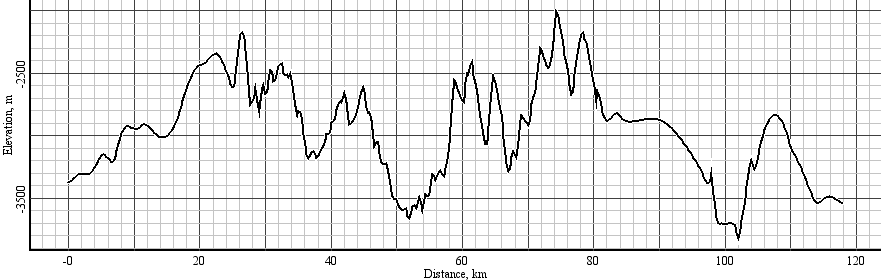
17.2 The distance between the highest points of the opposing ridges average around 50km +/- 10km or so. Taking the given rate of ridge movement from;
http://pubs.usgs.gov...erstanding.html
"The rate of spreading along the Mid-Atlantic Ridge averages about 2.5 centimeters per year (cm/yr), or 25 km in a million years."
It would then seem possible that if the geologic clock were to be ran backwards, and the last 2 million years of divergent boundary infill was removed, we would be observing a combination of the two ridges into a summit resembling one similar to that of the Pacific, with a spreading center that was substantially more in alignment with its summit than the current very low basin that now occupies the area where the actual boundary is currently separating.
17.3 This model proposes that the same GPE derived compression that raised so much crustal mass into ranges around the world during the Pleo-Pleistocene era did the same to this boundary. And if that compression could have been diverted into a compression relieving mechanism such as a convergent trench then the Atlantic ridge would more resemble the Pacific’s very small summit profile while the overall structure would be reduced substantially to one resembling the Pacific’s mere 500 m. elevation.

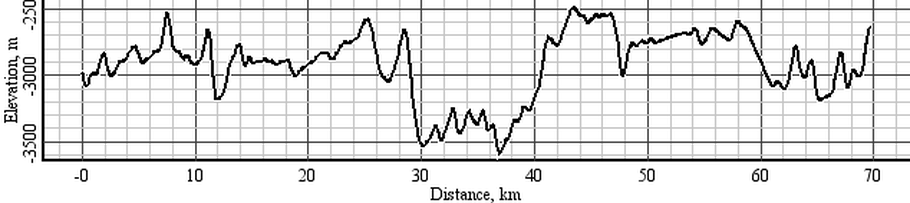
17.4 The circumstances involved in the development of the Atlantic ridge can be determined by the way these two boundaries responded to that geologic event that formed the Himalayas, the Andes and many other ranges several million years ago. The mountain building era requires a prior period of almost continual outward mantle displacement to put in place an unusually large inventory of divergent boundary material.
I am referring to a specific period of time several million years ago when mountain ranges around the world suddenly rose up. These mountains are on continental to continental boundaries (Himalayas), oceanic to continental boundaries (Andes), and as I'm claiming here, oceanic to oceanic boundaries (Mid Atlantic Ridge). I can show the Atlantic's exceptional size (and yes it is exceptional compared to all other MORs) is the result of the same forces as those other mountain ranges mentioned, and others not mentioned but date to the same time period. So this idea is about globally dispersed boundary deformation that took place around 2-4 million years ago. The reasons why some boundaries produced mountains and others didn't will hopefully be explained here.
“According to Wu et al. (2001) from the Pliocene to the Early Quaternary (5-1.1 Million years) the Kunlun Pass area of the Tibetan Plateau was no more than 1500 m high and was warm and humid.”
17.5 The time frame I’m discussing here begins at that time of the Pliocene and extends into the Pleistocene where most of this mountain uplift was largely completed. This was a massive expenditure of energy in an incredibly short period of time. And it occurred in both hemispheres and multiple continents all at the same time. Does anyone find this more than a little challenging for the standard model to explain?
OK, back to square one.
Let’s imagine that the new divergent boundary infill that is currently being placed in all the world’s MORs is due to the Earth’s crust is being simultaneously moved outward by the mantle oscillations as described by;
https://www.academia.edu/38174615/Mantle_thermal_pulses_below_the_Mid_Atlantic_Ridge_and_temporal_variations_in_the_formation_of_oceanic_lithosphere
"A 20-Myr record of creation of oceanic lithosphere at a segment of the central Mid-Atlantic-Ridge is exposed along an uplifted sliver of lithosphere.The degree of melting of the mantle that is upwelling below the ridge, estimated from the chemistry of the exposed mantle rocks, as well as crustal thickness inferred from gravity measurements, show oscillations of ,3–4 Myr superimposed on a longer-term steady increase with time.The time lag between oscillations of mantle melting and crustal thickness indicates that the solid mantle is upwelling at an average rate of ,25mmyr, but this appears to vary through time."
The four important clues that stand out to me and can be correlated to this model are;
1.-A 20-Myr record of creation of oceanic lithosphere
2.-oscillations of ,3–4 Myr
3.-longer-term steady increase with time
4.-the solid mantle is upwelling at an average rate of ,25mmyr, but this appears to vary through time."
17.6 Now let’s look at a simple dynamic model of the earth’s crust that resembles what the convergent and divergent boundaries looked like prior to that period described by Dr. Ollier below;
ANNALS OF GEOPHYSICS, SUPPLEMENT TO VOL. 49, N. 1, 2006
Mountain uplift and the Neotectonic Period
CLIFF D. OLLIER
School of Earth and Geographical Sciences, University of Western Australia, Perth, Australia
9.2. EXAMPLES
9.2.1. Tibet, Himalayas, Kunlun Mountains
(As an example, consider the timing of uplift in Tibet and its bordering mountains. Gansser (1991) wrote: «... we must realize that the morphogenic phase is not only restricted to the Himalayas but involves the whole Tibetan block. This surprising fact shows that an area of 2500000 km2 has been uplifted 3000-4000 m during Pleistocene time and that this uplift is still going on.» In places the uplift rate is 4.5 mm/yr (five times the maximum in the European Alps).
According to Wu et al. (2001) from the Pliocene to the Early Quaternary (5-1.1 Million years) the Kunlun Pass area of the Tibetan Plateau was no more than 1500 m high and was warm and humid. They write: «The extreme geomorphic changes in the Kunlun Pass area reflect an abrupt uplift of the Tibet Plateau during the Early and Middle Pleistocene. The Kunlun-Yellow River tectonic movement occurred 1.1-0.6 Million years.» Zheng et al. (2000) concluded from sediments at the foot of the Kunlun Mountains that uplift began around 4.5 Million years.)
17.7 And consider these studies of the Andes also;
http://www.rochester...n-in-the-andes/
“This study provides increasing evidence that the plateau formed through periodic rapid pulses, not through a continuous, gradual uplift of the surface, as was traditionally thought,” said Garzione. “In geologic terms, rapid means rising one kilometer or more over several millions of years, which is very impressive.”
“What we are learning is that the Altiplano plateau formed by pulses of rapid surface uplift over several million years, separated by long periods (several tens of million years) of stable elevations,” said Garzione.
http://www.rochester...how.php?id=3167
“Tectonic Theory May Need Revision in Light of New Study in Science”
“Mountains may experience a "growth spurt" that can double their heights in as little as two to four million years—several times faster than the prevailing tectonic theory suggests.”
“By studying sedimentary basins in the high Andes Mountains, the team could determine when and at what altitude these ancient sediments were deposited. That record of altitude changes shows that the Andes Mountains rose slowly for tens of millions of years, but then suddenly lifted much faster between 10 and 6 million years ago.”
17.8 This mountain building in the Himalayas, Andes and other locations started with raising large areas of much lower land simultaneously around the world in very short periods of time.
If we could imagine that the crust could supply its own energy to do this by utilizing the GPE it attains when the mantle changes from when 4.-“the solid mantle is upwelling at an average rate of ,25mmyr” to when it moves down once again.
The GPE in the crust would then increase because the divergent boundary infill in all boundaries from the last “upwelling” phase of the cycle would need to push the plates towards a convergent trench to equalize the growing compressive energy that the most recent infill is now being subjected to and is passing on to all the planet’s plates.
17.9 We should then be able to look at the boundaries around the world, both convergent and divergent, and see evidence of their interaction with this last episode of higher GPE that occurred during the Plio-Pleistocene mountain building era.
An important point to remember is; if the crust that is adjacent to the boundary (convergent or divergent) is unable to move towards a lower energy state that is at a level of resistance low enough to process the mantle’s rate of subsidence, then the boundary, whether it is convergent or divergent, will be subjected to higher compressive energies.

18.1 This image above represents a divergent boundary similar to the Pacific’s. If we were to imagine the mantle under it had begun moving downward the two continents would begin to move towards each other, and because the world is a sphere they would move towards all the other continents as well.
The opposing oceanic plates that are portrayed in the image would begin to compress their divergent boundary. But the resulting compression could only reach to the level that the subducting crust encounters at the opposing convergent trenches. The trenches behave as compression relieving mechanisms and limit the amount of compression the divergent boundary can be subjected to.
The opposing oceanic plates that are portrayed in the image would begin to compress their divergent boundary. But the resulting compression could only reach to the level that the subducting crust encounters at the opposing convergent trenches. The trenches behave as compression relieving mechanisms and limit the amount of compression the divergent boundary can be subjected to.
18.2 This illustration above represents a combined continental/oceanic spreading center arrangement similar to that of the Atlantic’s. The oceanic crusts are attached to their parental continents as they have been since they first divided. As the two continents move towards each other the convergent boundary is loaded with compression, the oceanic plates respond to this in the only way they can, by pushing back.
In this scenario it would be reasonable to expect the Atlantic boundary, in not having the compression relieving mechanisms of convergent boundary trenches, would experience higher levels of compression then the Pacific would.
When there is (1).-“A 20-Myr record of creation of oceanic lithosphere” with (2).-“oscillations of ,3–4 Myr”, during which they have a (3).-“longer-term steady increase with time” during which (4).-“the solid mantle is upwelling”; the following subsidence period would have a larger portion of GPE in the crust.
A “steady increase with time” over a period of 20 million years would leave a gradually building inventory of surplus divergent boundary material to be dealt with. When the “20 Myr increase with time” period finally comes to an end and a longer than normal period of subsiding mantle is waiting there for it, the Plio-Pleistocene mountain building period that occurred around the planet would be the result.
18.3 These illustrations below represent a combined continental spreading center arrangement similar to that of the Atlantic’s. The oceanic crusts are attached to their parental continents as they have been since they first divided.
18.4 As the mantle moves downward the oceanic crusts are loaded with proportional amounts of GPE. The only compression relieving mechanism available in this situation is the continents will need to overcome the resistance that they have to moving to a lower energy state by sliding towards the nearest convergent boundary available. In the Atlantic’s situation this would undoubtedly be greater then what the Pacific’s oceanic plates are subjected to. For example: the energy required to move N. America over the subducted Farallon and then Pacific oceanic plates would be much greater than what the Pacific expends just subducting into an adjacent convergent trench.
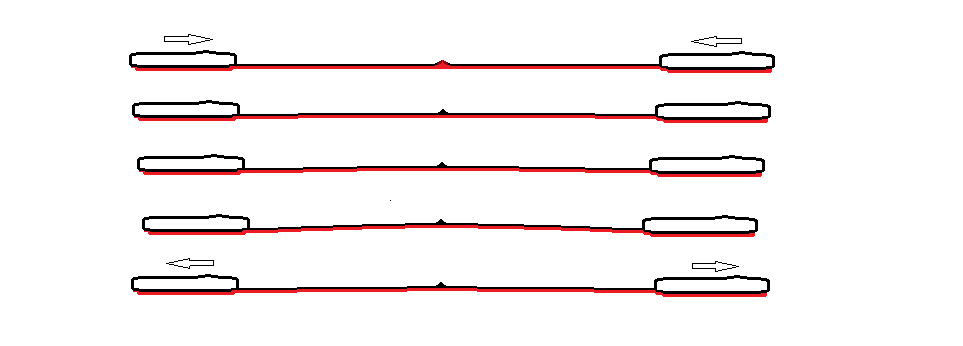
18.5 In these images above the subsiding mantle during a typical non mountain building subsidence period loads the crust with increasing levels of GPE, eventually this compression will dissipate as the continents are forced shift to a lower energy state (bottom image)
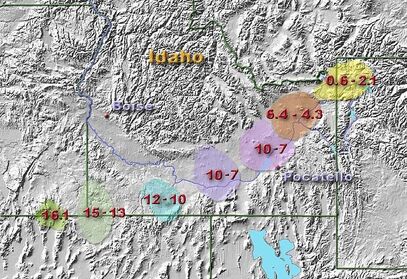
Does this scenario described above match the observations? Can we find the exact evidence of this happening? We should find evidence that the North American continent was periodically moved at intervals matching the evidence that link the "oscillations of ,3–4 Myr" of the Bonatti paper.
In the image at left the individual eruption tracks of the Yellowstone Super volcano show the periodic movement of the North American continent as it is forced west over the remnants of the Farallon and Pacific plates by the actions of the Atlantic oceanic plates described above as they unload their inventory of GPE derived compression.
Each date represents in millions of years the time period the continental plate was stationary when the "Mantle thermal pulses" reactivated the volcano hotspot/mantle-tear to erupt through the overriding plate. But eventually the "Mantle thermal pulse" would end and the mantle subsides and begins loading those Atlantic oceanic plates above with tremendous levels of compression that would eventually drive the North American plate to its next position. This would repeat with each mantle thermal pulse as is show by each individual eruption's position.
A very important point to make here is there is currently not one hypothesis available to explain how the North American continent is driven over the Farallon and Pacific plates. There is no down going slab pulling it or any way a mantle convection current could directly engage it.
And don't forget this paper;
http://www.dst.uniroma1.it/sites/default/files/doglioni/E6-15-03-13-TXT.aspx.html
MANTLE DYNAMICS AND PLATE KINEMATICS
Carlo Doglioni, La Sapienza University, Rome, Italy
Roberto Sabadini, University of Milan, Italy
". . . . . none of the proposed models of mantle convection can account for the simpler pattern in plate motion we observe at the surface, nor has a unique solution been proposed for how material in the mantle convects. At the moment there is no way to link mantle dynamics and plate kinematics at the surface, considering that the mantle and lithosphere are detached. The Atlantic and Indian ridges are in fact moving apart with respect to Africa, proving not to be fixed both relative to each other and relative to any fixed point in the mantle. This evidence confirms that ocean ridges are decoupled from the underlying mantle."
What would we expect to see during those mountain building periods?
The GPE is greater during these periods and would compress the Atlantic oceanic plates to greater levels. It would actually raise the oceanic plate’s elevation, crushing the boundary substantially over time.
The boundaries newest infill would be the thinnest and softest material. The greater levels of GPE would crush these weakest areas of the crust, eventually transforming this boundary into the largest oceanic mountain range on the planet.

18.6 Extraordinary levels of divergent boundary infill during extended periods of outward mantle displacement (below) is crucial for the mountain building periods to occur.
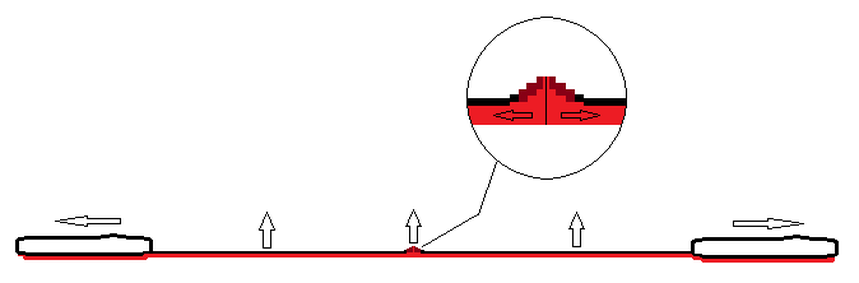
18.7 This material is what will provide the higher levels of gravitational potential energy derived compression that will later be needed when the mantle subsides to drive the planet’s crust into kinetic movement beyond the subduction trenches rate of resistance and redirect the divergent GPE to an alternate kinetic path of least resistance in the form of mountain ranges like the Himalayas and the Andes.
The prior period in question would be when the Basin and Range Province was created along with many other documented cases of crustal extension that took place in the Miocene.
18.8 This model proposes that the mantle’s outward movement at these times opens all of the divergent boundaries to magma intrusion simultaneously. This periodic boundary infill material is what will later produce the increase of gravitational potential energy in the crust that drives subduction. And in the case of the Mid Atlantic Ridge, this material will produce when the mantle subsides, the forces needed to drive the various subducted plates under the two opposing continents, for example, the energy to drive N. America over the Farallon and Pacific plates.
When the thermal cycle changed direction and the mantle moved downward, the opposing continents of the Atlantic Ocean moved down also, converting their gravitational potential energy into kinetic that begin compressing the oceanic plates of the Atlantic.
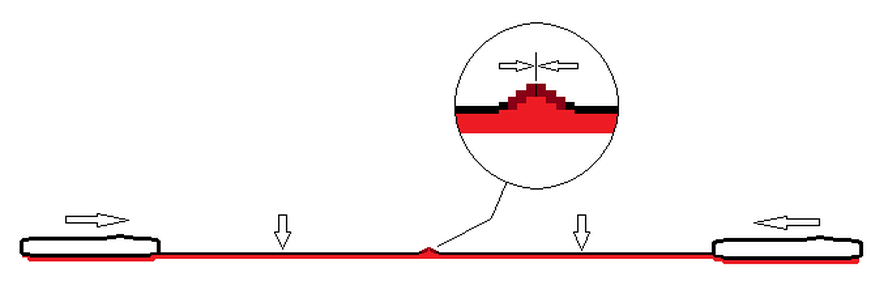
18.9 This of course would result in the Atlantic boundary being loaded with much higher levels of compression, more than any of the other mid ocean ridge sections. This is because the others like the Pacific have convergent boundaries that will process these higher compression energies while the Atlantic has no such compression relieving mechanisms, so the Atlantic MOR will be required to store this compressive energy as raised mass, just as the continental plates were required to do in the form of mountain ranges above sea level.

19.0 These illustrations below represent a combined continental spreading center arrangement similar to that of the Atlantic’s. The oceanic crusts are attached to their parental continents as they have been since they first divided.
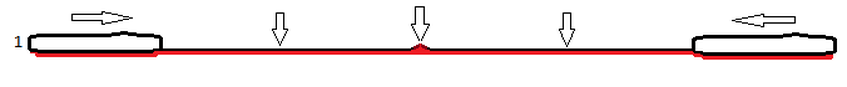
(1) The period of thermal expansion has ended and the mantle has begun to subside. As the entire Earth’s crust moves downward the two continents pictured will be forced towards each other.

(2) The spreading center will close and compression in proportion to the continent’s movement will begin to deform and raise the boundary area. The thermal cycle’s mountain building compressional periods are only 4 +/- million years long, so the oceanic crust and boundary only need to endure the growing GPE until the cycle changes once again to thermal expansion.

(3) and (4) The entire oceanic crust must rise up as the boundary area becomes less compressible, the older and thicker crust further back from the boundary can resist the energies more easily without expressing the vertical displacement taking place at the boundary.

19.1 This model can be used to decipher some rather new and extrodinary revelations about the Atlantic MOR.
Due to uneven compressional loading of the oceanic plates some of the narrower sections will need to process a much larger portion of GPE. And due to this substantially larger loading of the narrower and much smaller plate widths these sections will eventually fail and slip vertically along their transitional faults.
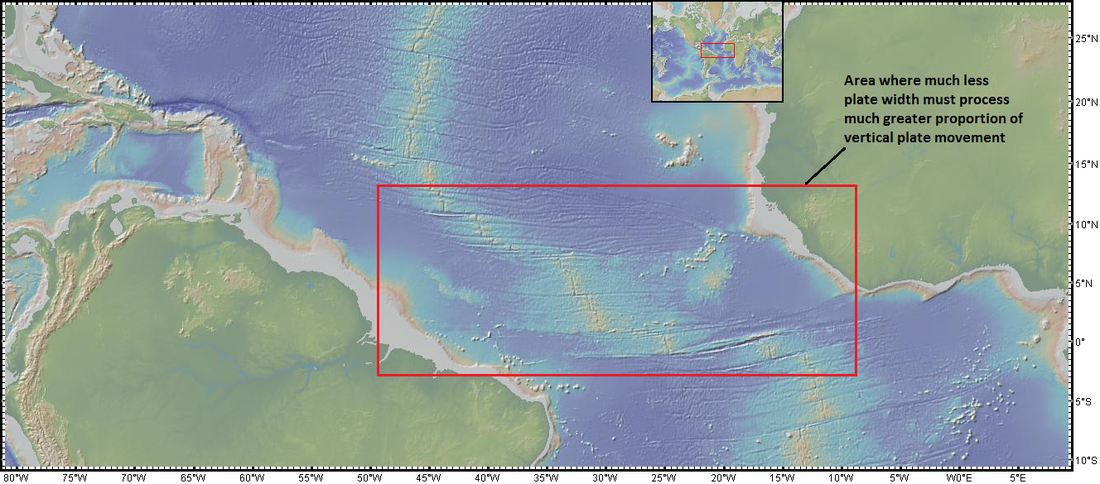
Images and cross sections above and those below were furnished through and in no way endorsed by http://www.geomapapp.org using Global Multi-Resolution Topography (GMRT) Synthesis,
Ryan, W. B. F., S.M. Carbotte, J. Coplan, S. O'Hara, A. Melkonian, R. Arko, R.A. Weissel, V. Ferrini, A. Goodwillie, F. Nitsche, J. Bonczkowski, and R. Zemsky (2009), Global Multi-Resolution Topography (GMRT) synthesis data set, Geochem. Geophys. Geosyst., 10, Q03014, doi:10.1029/2008GC002332.
Data doi: 10.1594/IEDA.0001000, through http://creativecommons.org/licenses/by-nc-sa/3.0/us/
19.2 The crust in these higher compressional energy fault sections are located at the narrowest point of the Atlantic basin in the equatorial region. This model will show these areas will need to move upwards, higher than the much wider sections to the north and south, to relieve the higher compressive stresses that they are exposed to.
And when there is a large differential between the quantity of divergent boundary material and the degree of mantle subsidence, as is the case with the Pleo-Pleistocene, there would be a tremendous amount of compression in the crust that would produce energies beyond what any convergent boundary could process. The Himalayas, the Andes and all other convergent and divergent boundaries are where this energy became stored. And in the case of the Atlantic ridge the energy level would be more than that divergent boundary could hold.
If an oceanic divergent boundary was located very close to the center of the ocean basin, as is the case of the Atlantic, with the oceanic crust extended unbroken from each continent, the compressive energy could be expected to have likely raised the oceanic crust’s center in a wide arch.

And it would remain raised until the GPE in the crust would be slowly removed as the North American continent was pushed over the Pacific and Farallon plates.
19.3 But this boundary arrangement has a built in vulnerability. The boundary alignment would probably include the likelihood that the divergent boundary materials would begin to fail before all of the GPE could be removed through the movement of the opposing continents and would result in an arrangement resembling the current Atlantic ridge.
As the GPE began to wane the compression that kept the boundary raised would likely allow the crust sections on either side of the ridge to sag and this would crush the lower edges of the divergent boundary together, deforming them and moving the boundary upwards.
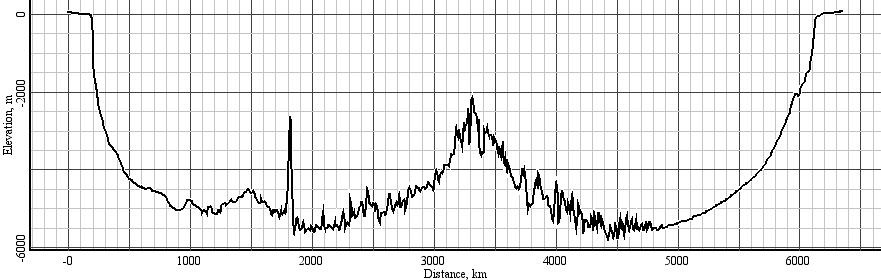
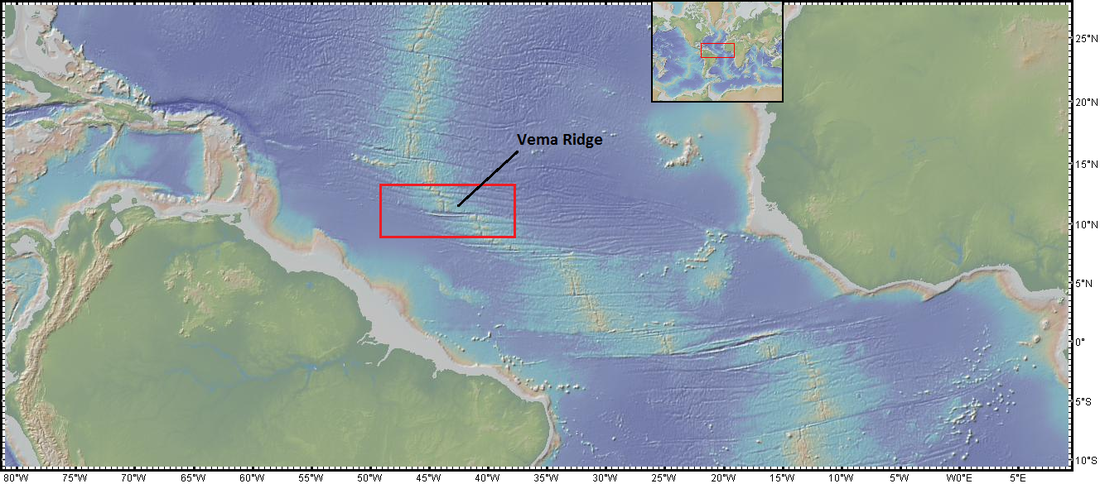
19.4
http://www.researchgate.net/publication/221939638_The_Vema_Transverse_Ridge_(Central_Atlantic)
Multibeam morphobathymetric coverage of the entire Vema Transverse ridge shows it is an elongated (300 km), narrow (<30 km at the base) relief that constitutes a topographic anomaly rising up to 4 km above the predicted thermal contraction level. Morphology and lithology suggest that the Vema Transverse ridge is an uplifted sliver of oceanic lithosphere. Topographic and lithological asymmetries indicate that the transverse ridge was formed by flexure of a lithospheric sliver, uncoupled on its northern side by the transform fault. The transverse ridge can be subdivided in segments bound by topographic discontinuities that are probably fault-controlled, suggesting some differential uplift and/or tilting of the different segments. Two of the segments are capped by shallow water carbonate platforms, that formed about 3–4 m.y. ago, at which time the crust of the transverse ridge was close to sea level. Sampling by submersible and dredging indicates that a relatively undisturbed section of oceanic lithosphere is exposed on the northern slope of the transverse ridge. Preliminary studies of mantle-derived ultramafic rocks from this section suggest temporal variations in mantle composition. . . . . .
Studies of depth-sensitive fossils and diagenetic textures in the dredged lime-stones have provided the rough outlines of a paleodepth versus age history for the transverse ridge crest. The summit of the transverse ridge was at or above sea level up to about 3 m.y. age, and has since subsided to its present depth (Bonatti et al., 1983). . . . . . .
We carried out one dredge on the limestone cap (dredge EW9305-1), recovering a large block of coral resting on a platform of coarse cemented biogeneous calcareous sand, plus smaller pieces of heterogeneous cemented biogeneous limestones, and half a dozen rounded pebbles resembling beach pebbles. . . . . .These new samples are compatible with the previous interpretation that the limestone cap was formed near sea level and subsided to its present location.
This is a horizontal, prominent reflector, which has been interpreted as an erosional surface, lying within the limestone platform, which was planned off at sea level when the transverse ridge stood higher than at present.
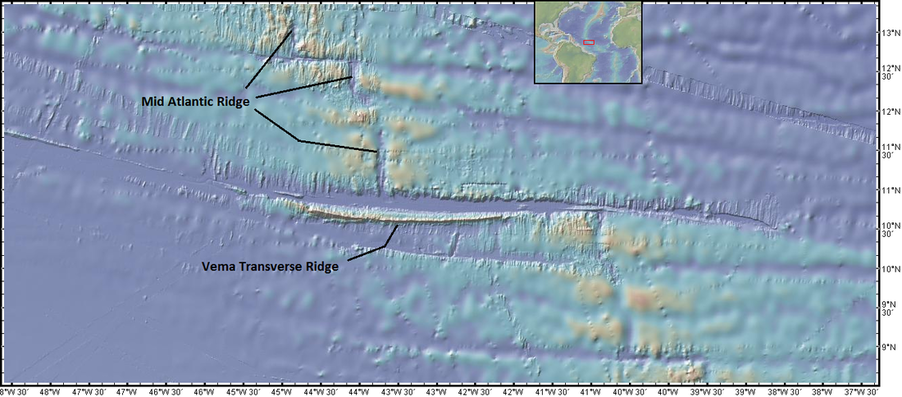
19.5 This hypothesis is strongly supported by the evidence of the oceanic crust's uplift to "at or above sea level" during the Pleo- Pleistocene mountain building era. The standard model has little ability to explain the evidence of a massive disposition of compressive energy during this specific time period when the uplift of Himalayas and Andes were also largely completed. The evidence shows the Mid Atlantic Ridge was exposed to the same forces during the same time period and responded in the same manner.
The evidence of mantle oscillation on 3-4 million year periodicities allow us to locate other periods of extreme crustal compression within this same boundary area.
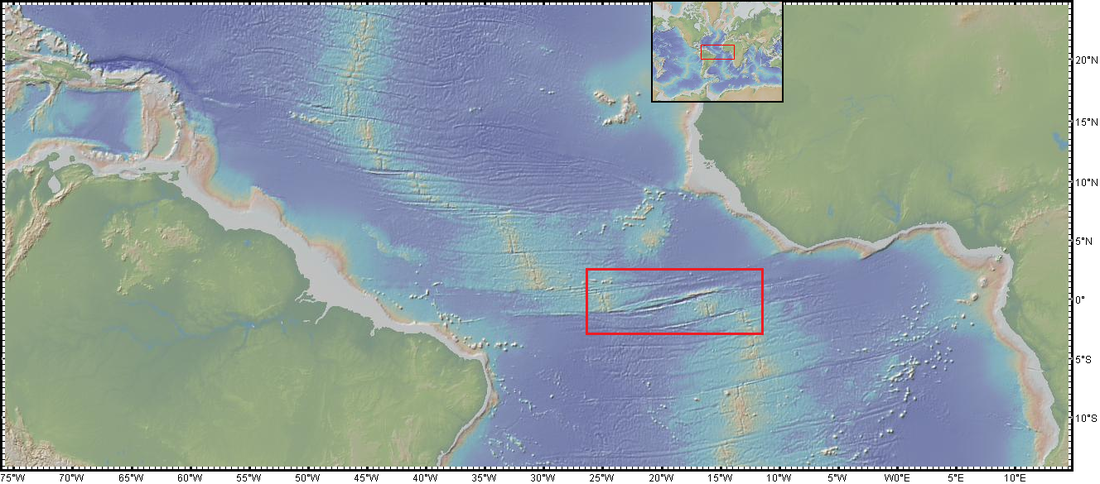
The Romanche transform offsets the Mid Atlantic Ridge by about 900 km and is the largest of a set of major equatorial Atlantic fracture zones. Assuming for the crust adjacent to the transform an average spreading rate of 1.75 cm/yr (Cande et al., 1988) and a constant ridge/ transform geometry, the age offset of the Romanche transform is roughly 50 million years. A transform-parallel transverse ridge, running adjacent to the northern side of the fracture zone is particularly prominent for a stretch of several hundred kilometers centered opposite to the eastern ridge/ transform intersection (RTI), where the topographic anomaly reaches 4 km above the predicted thermal contraction level (Bonatti et al.,1994). Seismic reflection data and extensive rock sampling indicate that the western portion of the transverse ridge . . . . consists of slivers of uplifted oceanic crust and upper mantle (Bonatti et al.,1994). The summit of the transverse ridge is capped in this area by Miocene shallow water limestones that reached above sea level about 20 ma, and then subsided at a rate faster than that of “normal” lithospheric cooling. (Gasperini et al.,1997a). . . . .The presence of such a thick sedimentary sequence, including deep-water sediments as old as 140 Ma, less than 150 km from the RTI, does not fit a normal sea-floor spreading scenario and opening of the equatorial Atlantic.
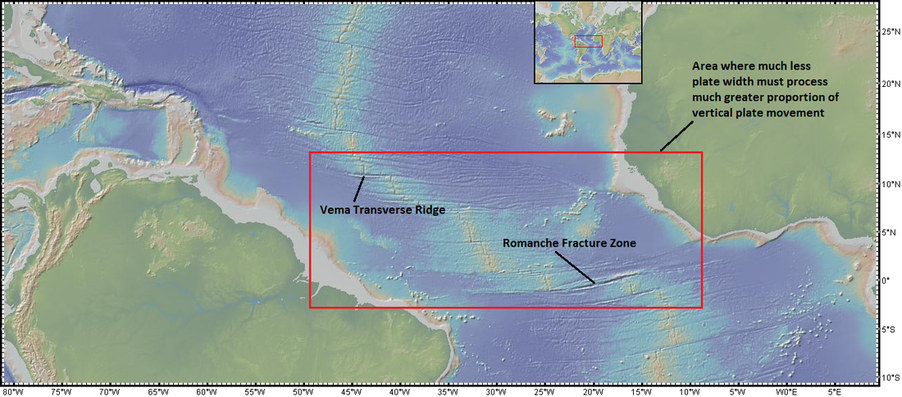
19.7
The Romanche Fracture Zone also allows this model to solve a mystery concerning the age of deep water sediments overlaying what was thought as younger oceanic crust.
"Assuming for the crust adjacent to the transform an average spreading rate of 1.75 cm/yr (Cande et al., 1988) and a constant ridge/ transform geometry, the age offset of the Romanche transform is roughly 50 million years."
"The presence of such a thick sedimentary sequence, including deep-water sediments as old as 140 Ma, less than 150 km from the RTI, does not fit a normal sea-floor spreading scenario and opening of the equatorial Atlantic."
19.8 This model predicts that the standard model's "sea floor spreading scenario" could be temporally asymmetrical. Since the rate of compression in the crust is now proposed to be of a variable content, It could take longer for the crust to subduct into a cooler and contracting crust/mantle boundary then it took to emplace it during the previous period of higher thermal content.
Another prediction that this model can make is the crust in these higher compressional energy fault sections near the equatorial regions will need to move upwards, higher than the much wider sections to the north and south, to relieve the higher compressive stresses that they are exposed to in these narrower areas.
19.9 This model explains that the Vema and Romanche ridges, located in the central Atlantic and being so close to each other, is not random or a coincidence. If the mantle was to move down ever so slightly and move all the plates towards each other simultaneously, the four opposing continents of the Atlantic would compress in the manner seen below;
19.9 This model explains that the Vema and Romanche ridges, located in the central Atlantic and being so close to each other, is not random or a coincidence. If the mantle was to move down ever so slightly and move all the plates towards each other simultaneously, the four opposing continents of the Atlantic would compress in the manner seen below;

20.0 But an area of the Atlantic basin that is narrower (the equatorial being the only one) would be required to process a similar quantity of lateral continental movement that a wider basin area such as the North Atlantic would need to.
The narrower section would process this disproportionate and higher continental-movement-to-basin-width-ratio by either compressing the divergent boundary more or raising it higher than the adjacent and wider basin areas to the north and the south were raised.
The narrower section would process this disproportionate and higher continental-movement-to-basin-width-ratio by either compressing the divergent boundary more or raising it higher than the adjacent and wider basin areas to the north and the south were raised.
20.1 Almost 20 million years earlier than the Pleo - Pleistocene era a similar period of extreme crustal compression raised a narrow section of crust above sea level within that same narrow equatorial corridor that the Vema Transverse Ridge resides. It would thus seem likely that the entire Atlantic crustal area was compressed in unison, allowing the Vema and Romanche ridges to attain the highest points in reference to depth.
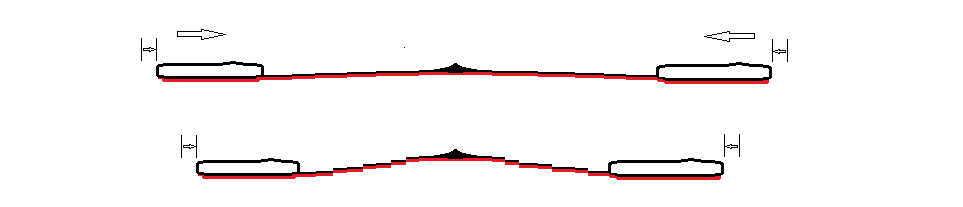
20.2 This narrow section of the Atlantic crust is required to accommodate the greater latitudinal metric generated by the crustal subsidence that is produced at the equator. The highest amount of surface compression that the crust can generate is realized by the 40,008 km (24,859.82 miles) of the equator's circumference. This will result in this narrow section of oceanic crust to rise to greater heights than the wider expanses of seafloor that lie to the north and south of this area.
We have seen with the evidence shown above that the Atlantic seafloor;
"show(s) oscillations of ,3–4 Myr superimposed on a longer-term steady increase with time. The time lag between oscillations of mantle melting and crustal thickness indicates that the solid mantle is upwelling at an average rate of ,25mmyr, but this appears to vary through time."
20.3 We have also seen how well those oscillations fit the periodic plate tectonic movement that is seen by the Yellowstone caldera's movement across N.America.

20.4 If the Mid Atlantic Ridge is shown by the evidence above to be displaced in periodic episodes as recently as several million years ago to as far back as 20 million years ago in the early Miocene, how much further back in time can these mantle oscillation be detected?
https://www.geoconvention.com/archives/2013/183_GC2013_Episodic_Tectonics.pdf
Episodic Tectonics in the Phanerozoic Succession of the North American Arctic and the “10 Million Year Flood”
Ashton Embry, Geological Survey of Canada, Calgary, [email protected]
Benoit Beauchamp, University of Calgary, Calgary, [email protected]
Keith Dewing, Geological Survey of Canada, Calgary, [email protected]
James Dixon, Geological Survey of Canada, Calgary, [email protected]
Conclusions
“Fifty-six, large magnitude sequence boundaries have been delineated in the Phanerozoic succession of Arctic North America. The characteristics of the boundaries indicate that they were primarily generated by tectonics. The boundaries occur with an approximate 10 million year frequency (9.8 +/- 3.1). Each boundary was generated during a tectonic episode interpreted to reflect a mantle-driven, plate tectonic reorganization and consequent changes in regional stress fields. Such episodes likely lasted for a few million years and were separated by longer intervals of relative tectonic quiescence. There are indications that the recognized tectonic episodes affected basins throughout the world.”
20.5
http://assets.geoexpro.com/legacy-files/articles/Sequence%20Stratigraphy%20Meets%20Plate%20Tectonics.pdf
"Thus I was faced with the hard-toescape interpretation that significant tectonic episodes affected large areas of the Triassic world and that they were separated by long intervals of relative quiescence. Derek Ager’s oft quoted quip that "the stratigraphic record is like a soldier’s life; long intervals of boredom separated by short intervals of terror" took on new meaning. The Triassic was of course the time when Pangea was in full bloom and one way of rationalizing such widespread tectonics was that I was actually looking at only one continent, albeit a super one. I then looked at my Jurassic unconformities that also had all the indicators of a tectonic origin." - Ashton Embry
20.6
http://www.geoconvention.com/archives/2013/183_GC2013_Episodic_Tectonics.pdf
"A given tectonic episode began with the initial uplift of the basin margin (start of base level fall) and ended with the collapse and marine flooding of the margin (maximum flooding surface). The sequence boundary was generated during the tectonic episode and represents the time of maximum uplift and basinward extent of the unconformity. It is estimated that the duration of each of the tectonic episodes was in the range of a few million years and was significantly shorter than the intervening times of tectonic quiescence."
20.7 We can now imagine that as the mantle eventually subsided, the continents, who's oceanic plates form the world's oceanic basins, would have been moved towards each other and compressed. (images below) This compression would have caused the basin margins to be forced upwards, as was observed by Embry et al above. And as the compression continued to grow the entire oceanic basin rose. As this happens it would have eventually caused the Mid Ocean Ridges to fail and rupture vertically in the manner shown in the preceding section. This would have caused the coastal margin to lower and produced those "Fifty-six, large magnitude sequence boundaries" that according to the above research have been observed around the world. Then the continents eventually moved apart to a lower energy state from the immense strain of the GPE produced by the raised oceanic crust.

20.8 The displacing oceanic plates would move or displace a substantial amount of ocean water around the globe. After several million years the sustained GPE would have eventually moved the continents further apart, thus causing the sea to withdraw from the flooded areas. Compare the diagram above to the one below provided by Ashton Embry et al. from their wonderfully perceptive work on this phenomena.
http://assets.geoexpro.com/legacy-files/articles/Sequence%20Stratigraphy%20Meets%20Plate%20Tectonics.pdf
http://assets.geoexpro.com/legacy-files/articles/Sequence%20Stratigraphy%20Meets%20Plate%20Tectonics.pdf
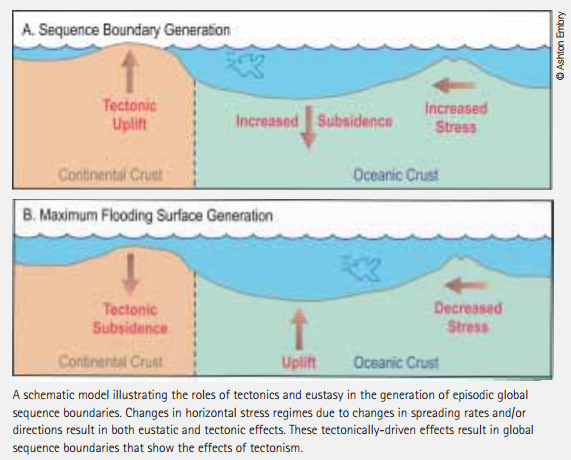
20.9 These two separately derived scenarios have very similar descriptions of oceanic crustal stresses and dynamics. The fact that the timing and duration of these events are of similar metrics would seem to be beyond simple coincidence, when you include the examples of the Yellowstone complex, the Himalayas and the Andes record of similar timing and duration, it would seem there is more than a casual connection at work here.
21.0
http://www.geoconvention.com/archives/2013/183_GC2013_Episodic_Tectonics.pdf
"It has also been determined that 16 of the18 Cambrian-Pliocene mass extinctions identified by Bambach (2006) coincide with an identified tectonic episode and that many of the tectonic episodes correlate with significant carbon isotope excursions (Saltzman and Thomas, 2012). Such correlations would imply that the episodes were the expression of a global phenomenon rather than one confined to the NA Arctic. Thus, it is quite possible that most, if not all, of the recognized, tectonically-generated, sequence boundaries of the NA Arctic represent episodic tectonics which occurred on a global scale. Given that all the tectonic plates are linked and a mantle-driven, major adjustment in the speed or direction of one plate would require compensatory movement changes in all the other plates, a phenomenon of episodic global tectonics occurring with a frequency of 5 -15 million years is a theoretical possibility."
In this paragraph above we can see that this model is well defined in their observations of the episodic timing, plate movement, and most importantly, the correlation " with significant carbon isotope excursions" This model's thermal fingerprint of the strain energy thermal content, that has repeatedly been shown to occur within the solar magnetic and seismic histories presented in this paper, is once again where we would expect it to be.
https://www.sciencedirect.com/science/article/pii/S1674987120301444#bib44
A 32-million year cycle detected in sea-level fluctuations over the last 545 Myr
Michael R.Rampino, Ken Caldeira
Abstract
"Spectral analyses of past relative sea-level oscillations as represented by the ages of 57 Phanerozoic (the last 545 Myr) stratigraphic sequence boundaries from the Canadian Arctic show a strong spectral peak at 32 Myr (>99.9% confidence). These findings concur with previous reports of significant cycles with periods of around 30 Myr in various records of fluctuations of sea level, and in potentially related episodes of tectonism, volcanism, climate, and biotic extinctions. Sequence boundaries commonly coincide with stage boundaries based on biostratigraphy, and are correlated with episodes of extinction and times of flood-basalt volcanism. The connection between tectonics and sea-level variations may come from changes in rates of ocean-floor spreading and subduction, intraplate stresses from plate-reorganizations, and pulsations of hotspot volcanism. These coordinated periodic fluctuations in tectonics, sea level and climate may be modulated by cyclical activity in the Earth’s mantle, although some pacing by astronomical cycles is suspected."
-------------------------------------------------------------------------------------------------------------------------------------------------------
Page 29
Correlation of
Extensional and compressional episodes to
Miocene, Pliocene and Pleistocene temperature record.
------------------------------------------------------------------------------------------------------------------------------------------------------------------------------------------------------------------
21.1 The model contends that the current divergent boundary metrics are the result of a strain energy response to the core/outer core's thermal expansion.
The mantle is 2,900 kilometers (1,800 mi) thick, that constitutes about 84% of Earth's volume. The Earth is 40075.16 kilometers in circumference with divergent boundary metrics measured in millimeters per year. The Pacific mid ocean ridge is the largest at 80-120 mm per year and the North Atlantic being 25 mm per year.
21.2 The total lateral displacement of the Basin and Range extension varied from 60 – 300 km over a period of around 7+/- million years. Just 42 mm a year of displacement at the Basin and Range area in that 7 million years time from around 17 to around 10 million years ago from the early to middle Miocene will give you the 300 km of displacement. Seems a reasonable figure compared to current Pacific at 80-120 mm per year and the North Atlantic being 25 mm per year.
The energy in molecular level thermal expansion is immense. But the thermal expansion energy displacing the divergent plate boundaries is not taking place in the mantle. The mantle is being outwardly displaced by the core's thermal expansion due to the increase of current and field by induction. The thermal expansion of the core's liquid iron will move outward with no regard to the mass of the mantle trying to compress it. It will not be stopped. The thermal expansion energy of core is multiplied by the thickness of the mantle similar to the inverse square law.
21.3 This study below shows an extensional event in Antarctica, also during the Miocene, but of course suggests the current standard model's reason, mantle upwelling in regards to a plume as a cause.
http://geodynamics.u...nts/frbdm08.pdf
"Our study documents two subsequent episodes of deformation occurring from Middle Miocene onward, concurrently with the McMurdo volcanism in the Admiralty Mountains region. The first is dextral transtensional whereas the second is purely extensional."
21.4 And of course this model suggests the strain energy derived thermal content enters the ocean through the 80,000 km (49,700 mi) long Mid-Ocean ridge system and is then delivered by the thermohaline circulation of the world ocean.
This NASA article about Antarctica warming in the Miocene expresses this nicely.
http://www.nasa.gov/...ca20120617.html
"Scientists began to suspect that high-latitude temperatures during the middle Miocene epoch were warmer than previously believed "
"The climate was suitable to support substantial vegetation -- including stunted trees -- along the edges of the frozen continent."
21.5 "Along the edges" where all that ocean thermohaline circulation heat is warming the atmosphere.
"the research team found summer temperatures along the Antarctic coast 15 to 20 million years ago were 20 degrees Fahrenheit (11 degrees Celsius) warmer than today, with temperatures reaching as high as 45 degrees Fahrenheit (7 degrees Celsius). Precipitation levels also were found to be several times higher than today."
"The peak of this Antarctic greening occurred during the middle Miocene period, between 16.4 and 15.7 million years ago."
21.6 And this extensional event; http://www.earth-prints.org/bitstream/2122/1511/1/01%20mascle.pdf
4. Conclusions
"Most of the structural characteristics from both features indicate important changes of tectonic styles around the Miocene. Thus, in the Mediterranean, the Tortonian to Messinian time span appears (to) be a key period, marked first by a wide spread extension episode, superimposed on previous collisional features both within the Tyrrhenian and Aegean domains."
21.7 So there appears to be a correlation between surface extensional events and warmer climate periods. And as I have shown there is ample evidence of a correlation to the mountain building period of the Himalayas and the cooling climate.
ANNALS OF GEOPHYSICS, SUPPLEMENT TO VOL. 49, N. 1, 2006
Mountain uplift and the Neotectonic Period
CLIFF D. OLLIER
School of Earth and Geographical Sciences, University of Western Australia, Perth, Australia
"According to Wu et al. (2001) from the Pliocene to the Early Quaternary (5-1.1 Million years) the Kunlun Pass area of the Tibetan Plateau was no more than 1500 m high and was warm and humid. They write: «The extreme geomorphic changes in the Kunlun Pass area reflect an abrupt uplift of the Tibet Plateau during the Early and Middle Pleistocene. The Kunlun-Yellow River tectonic movement occurred 1.1-0.6 Million years.» Zheng et al. (2000) concluded from sediments at the foot of the Kunlun Mountains that uplift began around 4.5 Million years.)"
21.8 This graph below shows this cooling, starting at the end of the Miocene (not shown) beginning at the left side of the top graph, and continuing through the mountain building period;
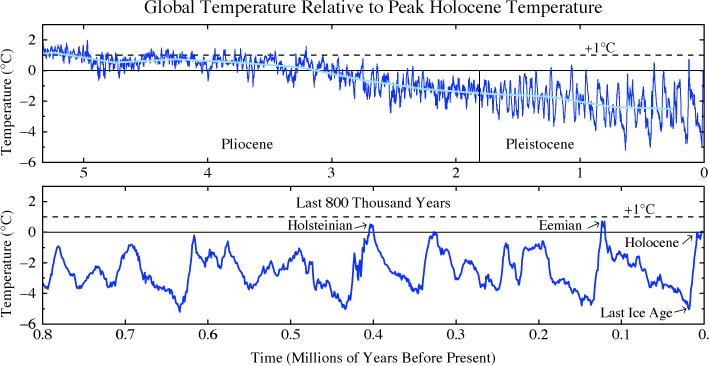
21.9 By the end of the Miocene the core temp began to cool and the mantle slowly contracted and began reloading the crust's inventory of compression, a long period of subduction was underway. As the crust is increasingly loaded with stored compression from the contracting mantle due to the resistance in the subduction trenches, the crust begins a period of global mountain building that occurred during the "Early and Middle Pleistocene." The compression continued to bleed off into the trenches until the crust began a slow and low energy period of activity. It's interesting to think the solar magnetic energy cycle that extended the Basin and Range was stored as mass in the crust then converted by gravity to kinetic energy that then lifted the mass of the Himalayas millions + years later.
--------------------------------------------------------------------------------------------------------------------------------------------------------------------------
Page 30
Model for
Mountain ranges on continental interiors
-----------------------------------------------------------------------------------------------------------------------------------------------------------------------------------------------------------------
22.0 The "Plate tectonics has no plausible explanation for mountains on passive margins or continental interiors" statement can also be answered by the expansion - contraction cycle of the mantle. Take the North American Cordillera (Rocky Mountains) for example, a long period of contraction of the mantle after a similarly long period of expansion with extension and thinning of the lithosphere, could provide the planation necessary to produce these structures. It’s that laminated structural dynamics again, the lithospheric layer is stretched and the overlying continental rock is extended and tensioned causing thousands of parallel faults during the long expansion period. Over the long period of expansion the surface erosion processes continually move the fractured debris downward into the continuously lowering and extending crust. The stretched, fractured and eroded material will have nowhere to go but up during the long contraction (shortening) that follows.
With the Rocky Mountains, the continent fractured in multiple parallel faults from high thermal expansion, while the lithosphere stretched and thinned. When the contraction period was in full compression the lithosphere compressed and folded under the fractured sections which were ruptured at high angles that bear witness to the large lateral expansion and then contraction that this region underwent.
Picture below was taken by Jesse Varner and was modified by Aza Toth both of whom have no connection with this author or this paper.
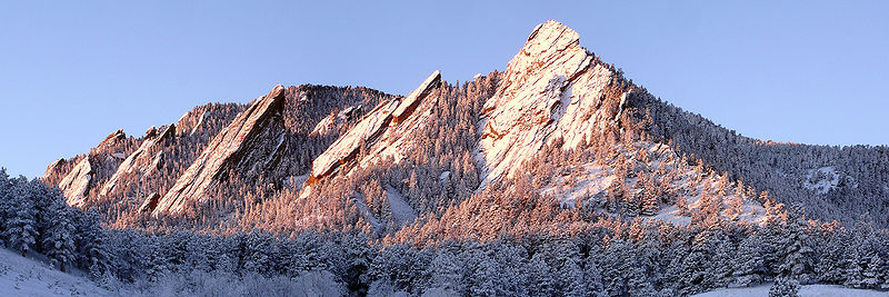
22.1 The Flatirons Mountains of the North American Cordillera (Rocky Mountains) outside of Boulder Colorado shows the results of being tension fractured by large scale extension (expansion), then contracted over compressed and folded lithosphere forming a tilted assemblage of overlapping and stacked slabs of crust. These structures were eroded out over 50 + million years. These are large thermal cycle events involving a core temperature variation over millions of years. This is how mountains are built in continental interiors.
-------------------------------------------------------------------------------------------------------------------------------------------------------------------------
Page 31
A model for
Plate dynamics of
Oceanic slab break-off and relocation
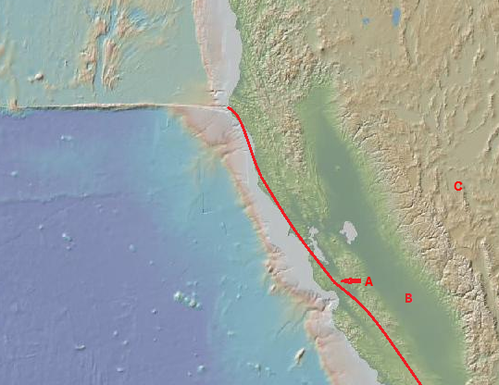
------------------------------------------------------------------------------------------------------------------------------------------------------------------------------------------------------------------
The Coast Range along the Pacific coast from the Baja Peninsula to Canada is a likely product of expansion-contraction cycles. As the mantle expanded, the ocean crust became tensioned pulling on the western coastal area. The Pacific plate's massive expanse gave it a high demand for the differential of allowable movement, 80-120 mm per year currently and probably greater during the Basin and Range extension of which time I believe the Pacific coast was extended. The coast of the northwest had overrode the last remnant of the subducted Farallon Plate, which at this time 10 to 17 million years ago had been followed by the East Pacific Rise's divergent boundary. The allowable movement in the Pacific Plate during the thermal expansion cycle produced a shorter but proportionate extension of the coastal plain area and may have lowered the basins of Puget Sound and Willamette Valley.
22.2 This scenario also includes the San Andreas Fault that was originally at one time the result of the shear tension fracture of the overran and held Pacific Plate. The fault can be viewed at various road cuts exhibiting the anti-intuitive form of the Pacific plate overlaying the North American plate, the exposed fault line cutting diagonally across the exposure. The current theory suggests the fault has been raised from great depth by uplift and then exposed thru erosion.
http://earthquakes.ou.edu/Wilson_Tejon_Pass.pdf
"rate of uplift being estimated as 2-5 millimeters per year based on plate motion considerations and modeling (Smith and Sandwell, 2003), as well as age determination analyses (Spotila et al., 2001). These rates indicate very intense exhumation of more than 5 kilometers (3.1 miles) since the Pliocene, which would likely expose deep portions of the fault-zone and gouge material and are consistent with estimates of nearby exhumed fault zones (Evans and Chester, 1995)."
Images A,B,B1,B2,C,C1,D,E,G,I,J used and modified by this author in the following section were furnished through and in no way endorsed by http://www.geomapapp.org using Global Multi-Resolution Topography (GMRT) Synthesis,
Ryan, W. B. F., S.M. Carbotte, J. Coplan, S. O'Hara, A. Melkonian, R. Arko, R.A. Weissel, V. Ferrini, A. Goodwillie, F. Nitsche, J. Bonczkowski, and R. Zemsky (2009), Global Multi-Resolution Topography (GMRT) synthesis data set, Geochem. Geophys. Geosyst., 10, Q03014, doi:10.1029/2008GC002332.
The Basin and Range extensional episode supplied a means to understand the likely position and depth of the already subducted Farallon Plate, and the Pacific Plate that followed it under the western continental crust in an almost parallel horizontal trajectory with the surface.
This section being the most recently produced had the lowest density with the highest temperature and that made it both too buoyant to sink and too soft for compression driven subduction into the deeper region of the asthenosphere. So once it was over ridden by North America, the Pacific plate stayed at a shallow almost straight inline path into the transitional area of the continent.
The Coast Range along the Pacific coast from the Baja Peninsula to Canada is a likely product of expansion-contraction cycles. As the mantle expanded, the ocean crust became tensioned pulling on the western coastal area. The Pacific plate's massive expanse gave it a high demand for the differential of allowable movement, 80-120 mm per year currently and probably greater during the Basin and Range extension of which time I believe the Pacific coast was extended. The coast of the northwest had overrode the last remnant of the subducted Farallon Plate, which at this time 10 to 17 million years ago had been followed by the East Pacific Rise's divergent boundary. The allowable movement in the Pacific Plate during the thermal expansion cycle produced a shorter but proportionate extension of the coastal plain area and may have lowered the basins of Puget Sound and Willamette Valley.
22.2 This scenario also includes the San Andreas Fault that was originally at one time the result of the shear tension fracture of the overran and held Pacific Plate. The fault can be viewed at various road cuts exhibiting the anti-intuitive form of the Pacific plate overlaying the North American plate, the exposed fault line cutting diagonally across the exposure. The current theory suggests the fault has been raised from great depth by uplift and then exposed thru erosion.
http://earthquakes.ou.edu/Wilson_Tejon_Pass.pdf
"rate of uplift being estimated as 2-5 millimeters per year based on plate motion considerations and modeling (Smith and Sandwell, 2003), as well as age determination analyses (Spotila et al., 2001). These rates indicate very intense exhumation of more than 5 kilometers (3.1 miles) since the Pliocene, which would likely expose deep portions of the fault-zone and gouge material and are consistent with estimates of nearby exhumed fault zones (Evans and Chester, 1995)."
Images A,B,B1,B2,C,C1,D,E,G,I,J used and modified by this author in the following section were furnished through and in no way endorsed by http://www.geomapapp.org using Global Multi-Resolution Topography (GMRT) Synthesis,
Ryan, W. B. F., S.M. Carbotte, J. Coplan, S. O'Hara, A. Melkonian, R. Arko, R.A. Weissel, V. Ferrini, A. Goodwillie, F. Nitsche, J. Bonczkowski, and R. Zemsky (2009), Global Multi-Resolution Topography (GMRT) synthesis data set, Geochem. Geophys. Geosyst., 10, Q03014, doi:10.1029/2008GC002332.
- Data doi: 10.1594/IEDA.0001000, through http://creativecommons.org/licenses/by-nc-sa/3.0/us/
- 22.3 Image A.
- So how else does an ocean plate that was subducting end up on top of the continental plate with what is probably over a hundred kilometers or more of overlap? They estimate the San Andreas Fault (A) just to the west of the Central Valley (B) is 15-20 million years old, which puts it around the time of the Basin and Range extension (Area C) estimated at 17 million years ago.
The Basin and Range extensional episode supplied a means to understand the likely position and depth of the already subducted Farallon Plate, and the Pacific Plate that followed it under the western continental crust in an almost parallel horizontal trajectory with the surface.
This section being the most recently produced had the lowest density with the highest temperature and that made it both too buoyant to sink and too soft for compression driven subduction into the deeper region of the asthenosphere. So once it was over ridden by North America, the Pacific plate stayed at a shallow almost straight inline path into the transitional area of the continent.
And as it was shown prior in the research paper that describes the sudden and forceful conversion of a divergent boundary into a convergent boundary, thus leading to the likely conclusion that it is increasingly apparent that the subducting plate's path is simply determined by the path of least resistance. That the subducting oceanic plate will only go where the surrounding geology will allow.
22.6 Taking the above into consideration when evaluating the behavior of the Farallon and then Pacific plate's subduction under the N. American Continent, the shallow subduction idea fits the observations quite well. This model proposes that with every cycle the Pacific plate moved in tandem with the decoupled divergent boundary as they were slowly overran by the periodic movement of the North American plate. The compression driven westward movement of the overriding North American plate produced a compounded drag effect on the top surface of the subducted ocean plate. The friction produced an upward curl or pull back in the plate, balancing the downward force of gravity against the overriding plates frictional drag. This allowed the Farallon plate to extend at a flat trajectory well into the basement of the Basin and Range area of Western Nevada and possibly as far as Utah while simultaneously raising the overriding Basin and Range region.
http://en.wikipedia.org/wiki/Basin_and_Range_Province
The tectonic activity responsible for the extension in the Basin and Range is a complex and controversial issue among the geoscience community. The most accepted hypothesis suggests that crustal shearing associated with the San Andreas Fault caused spontaneous extensional faulting similar to that seen in the Great Basin. However, plate movement alone does not account for the high elevation of the Basin and Range region.
This embedment can only occur when there is periodic supplies of compression available in the crust, driving the Farallon Ocean plate from the west and the continental crust from the east. This subduction accounts for the substantial rise in elevation of the Basin and Range that resulted as the oceanic plate was subducting and vertically displacing the continental crust above it.
22.7 The Pacific Plate had followed the East Pacific Rise in under the continent, the cooling mantle's contraction giving the overlapping plates the massive kinetic energy that can only be provided by sources of these scales. The Pacific Plate in that latitudinal section was held by the Mariana Trench in the western Pacific and the overriding North American continent to the east. During one of the expansion cycles, while the Basin and Range extension was occurring (area C below), and while the overlying continental crust was being pulled by the now retracting ocean crust, the underlying oceanic lithosphere was breaking the overlying surface area into hundreds of parallel faults.
,http://earthquakes.ou.edu/Wilson_Tejon_Pass.pdf
"A reconnaissance survey (Brune, 2001) of the apparent gouge-zones at more than ten sites along the San Andreas fault between San Bernardino and Tejon Pass resulted in the following observations: 1) there are no obvious shear planes or bands parallel to the fault; 2) at distances up to 200 meters from the fault the gneissic or granitic structure appears to be undisturbed, in particular – unsheared, while it consists almost entirely of fine-grained powder, suggesting that the rocks were powdered without shear distortion; 3) the powder occurs only in gneisses and granites, not in shallow sedimentary rocks, and 4) the rock powder contains myriads of fine-scale conjugate shear bands with displacement consistent with a maximum principal stress generally normal to the San Andreas fault." "The dominant rock in the San Andreas fault-zone at Tejon Pass is a light color granitic rock body that to the casual observer appears as intact granite with a granitic texture and sub-gneissic foliation in some places. However, this granite is pervasively shattered into powder, has no apparent cohesion and has easily eroded into badlands topography along the outcrop"
22.8 Is this powdered rock an indication that the fracture was due to extreme tension fracturing and not shear stress? If the oceanic plate was overran by the continental plate and held during a thermal expansion (displacement) period, a catastrophic amount of tension would build, resulting in an explosive release. Tension stretches and thins any material if enough energy is applied; the stresses are to the microscopic level in the granite. There would be enough tensile stress derived energy released to cause large retraction of the plate in both sides of the fracture zone. This may be what caused the Sierra Nevada block to be lowered to the west and tilted, the west end dropping to the central valley elevation, while the east end of the block remained on the retracted ocean plate section that rebounded to the east. Current estimated time period of the westward tilting of the block has the beginning starting at 10 million years ago. The Sierra Nevada block now had a fulcrum by way of the broken upper edge of the eastern ocean plate remnant.
https://www.nps.gov/parkhistory/online_books/geology/publications/pp/160/sec2a.htm
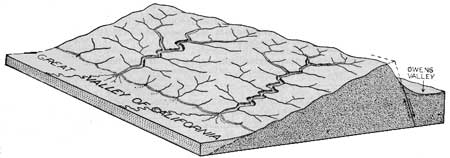
". . . . . .the present range consists essentially of a single massive block of the earth's crust that has been dislocated and tilted toward the southwest, apparently without suffering any appreciable bending or warping. (See fig. 1.) The Sierra Nevada is therefore properly termed a "block range." Even to the first geologists who explored the Sierra Nevada and the adjoining regions the real nature of its structure was apparent from its very shape and outlines. The long linear crest suggested the raised eastern edge of the block; the abrupt eastern escarpment, the side of the block exposed to view by the uptilting; and the gentle western slope, down which the main rivers flow, the slanting upper surface. The essential correctness of this early interpretation has been abundantly confirmed by later observers, who have collected considerable evidence, direct and indirect, showing that great master fractures extend along the eastern base of the range and around its curving southern part, and that on these master fractures the earth's crust has been dislocated, the Sierra block rising, and the block adjoining it on the east sinking, relative to each other, in the manner indicated by the arrows in Figure 1."
22.9.1
Is there evidence in the most recent research of an oceanic plate fracturing at these same massive scales in very similar circumstances?
This paper below describes such an event occurring at the Middle America Trench (MAT).
https://www.nature.com/articles/s41561-018-0229-y.epdf?referrer_access_token=HnO4WLMkwIDAFKrrT9rJIdRgN0jAjWel9jnR3ZoTv0PCVFi5Qgnv4AZa5anaERJuXVeI0Z9Swq0ea-YUFI2LVQ8XYXvH2evpIz7y0MpjjEksanddQ6LMf6qnf09O8vVzYYHDB5EnBhO9TcYikF3eacXtCXTB4no59PlmIpW7mzk464W0k1PzII2OrWtsMKJLpT438bM9HjQCsqWDqoP98Q%3D%3D&tracking_referrer=www.nationalgeographic.com
Deep embrittlement and complete rupture of the lithosphere during the Mw 8.2 Tehuantepec earthquake
Diego Melgar 1*, Angel Ruiz-Angulo 2, Emmanuel Soliman Garcia 3, Marina Manea 4,5, Vlad. C. Manea 4,5, Xiaohua Xu 6, M. Teresa Ramirez-Herrera 7, Jorge Zavala-Hidalgo 8, Jianghui Geng 9, Nestor Corona 10, Xyoli Pérez-Campos 11, Enrique Cabral-Cano 11 and Leonardo Ramirez-Guzmán 12
"The kinematic slip model of the earth quake challenges current structural models of subduction kinematics; there is normal-faulting (extensional) rupture throughout the entire lithosphere at a point where curvature is high and through portions that should be in flexural compression, and furthermore, rupture spreads well past the 650 °C geotherm (Figs. 1d and 4) into regions where global surveys find that no normal or thrust-faulting
intraslab outer-rise-associated seismicity has ever been observed. At the nucleation depth in the bottom half of the oceanic lithosphere, the slab appears to be in tension, contrary to what is predicted from mere flexure"
"Combining these observations, we conclude that, in spite of slab curvature being high (Fig. 3a), the entire lithosphere is under wholesale deviatoric tension, explaining the unusual location of a normal-faulting mechanism in areas expected to be in compression and extending to the base of the lithosphere."
"Thus, combined seismological and geodetic observations of the 2017 Mw 8.2 Tehuantepec, Mexico, earthquake reveal that almost the entire oceanic lithosphere, including the mantle and crust, ruptured in a single large intraslab normal-fault earthquake. It is possible that the 1931 normal-faulting Mw 8.0 Oaxaca earthquake, just east of the Tehuantepec Ridge, similarly broke the entire lithosphere and that both events are part of an ongoing larger-scale breakdown of the slab; however, limited historical seismograms make that determination difficult. Here, we have shown conclusively, with a wide diversity of geophysical observations, that under the right conditions, large earthquakes can nucleate in and rupture through the entire oceanic plate, even for young subduction zones."
23.1.5 So, we now have additional observational evidence that supports this model's contention that oceanic slabs can be repeatedly exposed to tensional stresses that cause the complete breaking and sectioning of the subducted oceanic plates. And, that these exact processes were predicted and describe by this model years before these latest observations were made.
The observations made by the research paper above fit nicely with those made by Keenan et. al., https://www.pnas.org/content/113/47/E7359; where a newer divergent boundary spreading center was suddenly changed to a convergent boundary. We can now imagine that while this scenario in Keenan et. al. was transpiring, a convergent boundary plate section like the one mentioned above at the Middle America Trench, was initially and simultaneously breaking when that divergent boundary in Keenan et. al. was first developing. Then as the mantle began to subside, both boundaries rapidly changed to a convergent dynamic. The Keenan et. al. converging for the first time while the ones similar to the Middle America Trench were reestablished below and maybe even above the previously subducted plate materials.
This process then, would periodically provide a new layer of continental building material that will eventually break free and be later under laid by another section, and thus allow the oceanic plates that are subducting into convergent boundaries on continental margins to periodically fracture in a manner resembling what was observed at the Middle America Trench.
So, as we look at these continental margins we can see the results made by these periodic extensional energies. The complete rupture of the lithosphere during the Mw 8.2 Tehuantepec earthquake at the Middle America Trench occurred deep within the convergent boundary, while the San Andres is a specific example of what would happen when a specific oceanic plate section breaks free far under the edge of an overriding crust. The weight of the Sierra Nevada Batholith was probably a contributing factor to where this plate eventually fractured just below the batholith's western edge. And the Juan de fuca ridge just to the north is an example of what occurs when a similarly tensioned, subducted and overridden section of oceanic plate was suddenly exposed to the energies of an adjacent catastrophic plate failure, resulting in the plate's sudden tension fracture failure localized at what is a considerable distance from the subduction zone where the plate was being consumed under the continental margin and where prior to this event lesser examples of these energies had been gradually processed and dispersed.
In the image below you can see the zig-zag tension fracture configuration of the now referred to Juan de Fuca and Gorda ridges and the Blanco Fracture complex as it runs north from its abrupt beginning at the Mendocino Fracture Zone. If we examine these structures through the lens of mantle displacement cycles these structures easily appear to originate as tension releasing mechanisms. Then as the mantle began subsiding and the energies change from tension to compression the much more ancient convergent boundary on the continental edge becomes the central location of plate energy dispersal.
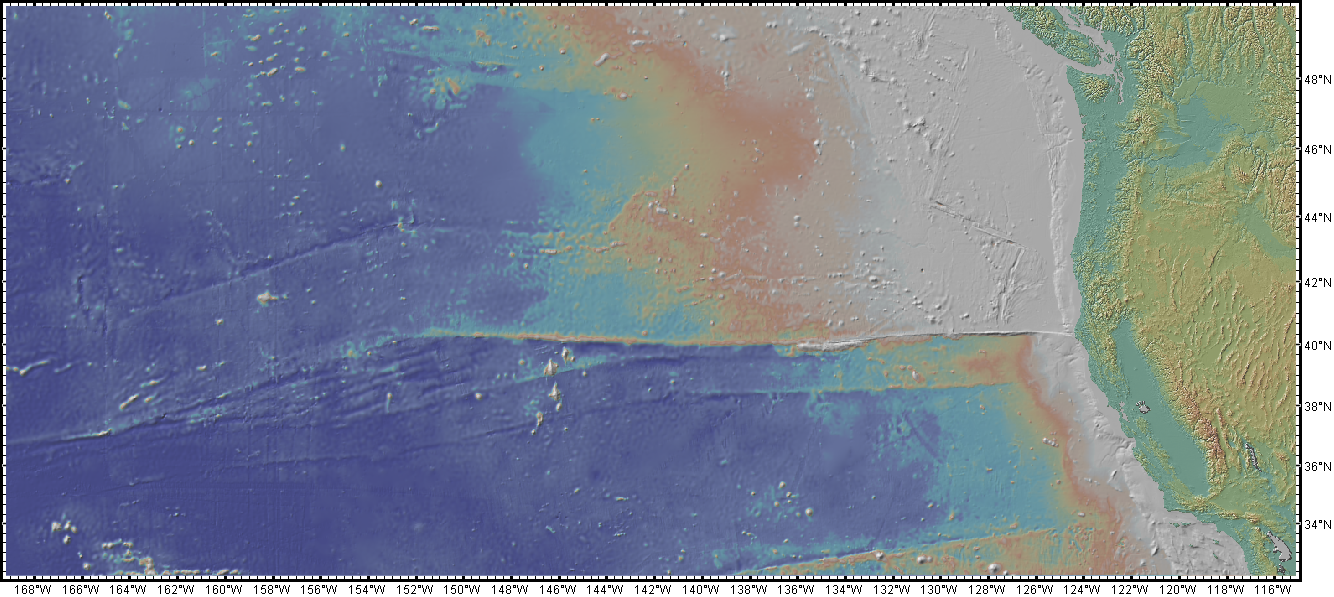
Each of these seemingly different geologic phenomena share the same origin in the periodic cycles of mantle displacement.
And once again we can also see how this model provides a source for new continental building materials.
Images and cross sections above and those below were furnished through and in no way endorsed by http://www.geomapapp.org using Global Multi-Resolution Topography (GMRT) Synthesis,
Ryan, W. B. F., S.M. Carbotte, J. Coplan, S. O'Hara, A. Melkonian, R. Arko, R.A. Weissel, V. Ferrini, A. Goodwillie, F. Nitsche, J. Bonczkowski, and R. Zemsky (2009), Global Multi-Resolution Topography (GMRT) synthesis data set, Geochem. Geophys. Geosyst., 10, Q03014, doi:10.1029/2008GC002332.
Data doi: 10.1594/IEDA.0001000, through http://creativecommons.org/licenses/by-nc-sa/3.0/us/
-----------------------------------------------------------------------------------------------------------------
Page 32
Evidence of Periodic Extension/compression Cycles in Oceanic Lithosphere
------------------------------------------------------------------------------------------------------------------------------------------------------------------------------------------------------------------
Page 32
Evidence of Periodic Extension/compression Cycles in Oceanic Lithosphere
------------------------------------------------------------------------------------------------------------------------------------------------------------------------------------------------------------------
Image C1. These images are in a series of higher resolutions of approximately the same location of the Atlantic Mid-Ocean Ridge. The ridge shows the lack of sediment that younger sea floor should exhibit. If the Mendocino structure had formed earlier in the sea floor's history, it would have had more sedimentary cover. If it had formed near the N.A. Continent it would have been covered like all the shoreline sea floor, in a thick outflow of continental sediment that far out paces the subduction processes that will consume the deposits millions of years in the future.
Images above and below used and modified by this author was furnished through and in no way endorsed by://www.geomapapp.org using Global Multi-Resolution Topography (GMRT) Synthesis,
Ryan, W. B. F., S.M. Carbotte, J. Coplan, S. O'Hara, A. Melkonian, R. Arko, R.A. Weissel, V. Ferrini, A. Goodwillie, F. Nitsche, J. Bonczkowski, and R. Zemsky (2009), Global Multi-Resolution Topography (GMRT) synthesis data set, Geochem. Geophys. Geosyst., 10, Q03014, doi:10.1029/2008GC002332.
Data doi: 10.1594/IEDA.0001000, through http://creativecommons.org/licenses/by-nc-sa/3.0/us/
23.4 The lower degree of cover in the anomaly (A) above, allows the age of this structure to be reduced to the approximate age of the Basin and Range and more accurately to the period after the ocean plate fracture when the plate sections on either side of the Mendocino were initially offset by a substantial degree, leaving a relatively small gap in the fracture that was immediately filled by the hydraulic magma. This small infill became the first of many that were the result of the expansion-contraction cycle's mechanical advancement of the northern plate section and the lack thereof, of mechanical movement in the now disconnected southern (below the Mendocino) oceanic plate section. Something else worth mentioning, the Atlantic sea floor images show a finer grain in the ridge infill compared to the Mendocino anomaly. The two opposing continent's gravitational kinetic energies apply a tremendously larger amount of compression to the Atlantic divergent plate boundary infill. This would also explain the tremendous size and elevation of the Atlantic Mid-Ocean ridge system.
I have to be honest, the Google maps images are much more detailed for these seafloor examinations but you cannot use them. I suggest you take a look at them to see the improved resolution.
I have to be honest, the Google maps images are much more detailed for these seafloor examinations but you cannot use them. I suggest you take a look at them to see the improved resolution.
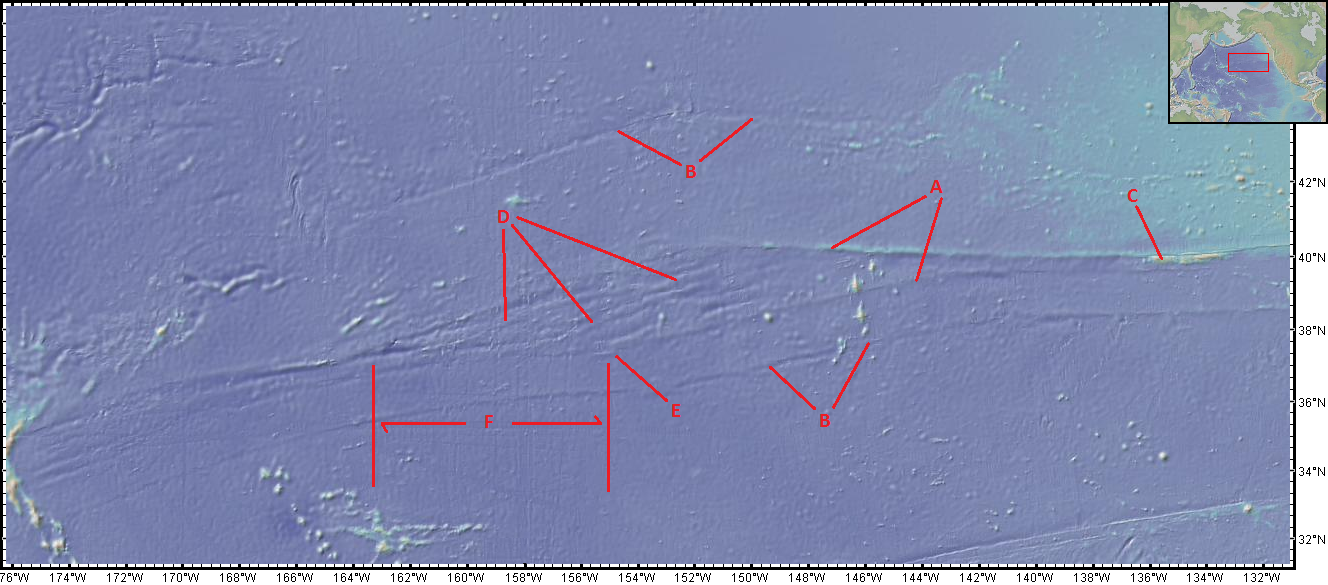
Image D. In this close-up of the Mendocino structure, the original edges (A) of the fracture are clearly seen. The infills of repeated thermal cycles are evident in the center (D). You can almost count how many of the expansion-contraction cycles have occurred. You can also see a single small intrusion (C) that may have broken loose during a cycle and then was lifted by new magma inflow. Once the mantle begins pressurizing the hydraulic magma that expands the crust, the magma will easily move into the divergent boundary as it slowly moves apart.
23.5 When the thermal cycle changes due to the cooling and contracting mantle the infill material will be compressed by the overwhelming forces of contraction that will form the new infill and surrounding seafloor to each other. You can see the deformation in the ocean plate on both sides of the anomaly (B). The continuous process started with a small infill; remarkably it is probably the one at the southern point (E). The anomaly has expanded approximately 1100 km. (F) since its beginning. The structure will continue to grow, slowly with each cycle, filling in and then moving to the west. This process will continue as the fracture and anomaly are over ran by the North American Continent and consumed. This is a strong record of the core-mantle thermal cycles.
Referring back to;
https://www.academia.edu/38174615/Mantle_thermal_pulses_below_the_Mid_Atlantic_Ridge_and_temporal_variations_in_the_formation_of_oceanic_lithosphere
Mantle thermal pulses below the Mid-Atlantic Ridge and temporal variations in the formation of oceanic lithosphere
Enrico Bonatti*†‡, Marco Ligi*, Daniele Brunelli*†, Anna Cipriani‡, Paola Fabretti*, Valentina Ferrante*†, Luca Gasperini* & Luisa Ottolini§
* Istituto di Scienze Marine, Geologia Marina, CNR, Via Gobetti 101, 40129, Bologna, Italy
† Dipartimento di Scienze della Terra, Universita` “La Sapienza”, Piazzale Aldo Moro 5, 00187, Rome, Italy
‡ Department of Earth and Environmental Sciences, Lamont Doherty Earth Observatory, Columbia University, Palisades, New York 10964, USA
§ Istituto di Geoscienze e Georisorse, Sezione di Pavia, CNR, Via Ferrata 1, 27100, Pavia, Italy
"A 20-Myr record of creation of oceanic lithosphere at a segment of the central Mid-Atlantic-Ridge is exposed along an uplifted
sliver of lithosphere. The degree of melting of the mantle that is upwelling below the ridge, estimated from the chemistry of
the exposed mantle rocks, as well as crustal thickness inferred from gravity measurements, show oscillations of ,3–4 Myr
superimposed on a longer-term steady increase with time. The time lag between oscillations of mantle melting and crustal
thickness indicates that the solid mantle is upwelling at an average rate of ,25mmyr, but this appears to vary through time."

23.6 There are approximately 6-7 distinct cycle infills in the anomaly. At the 3-4 million year frequency rate of the paper above the first infill would date it back to around 18-21 million years, thus fitting nicely to the model's claim that it is concurrent with the formation of the Basin and Range and the San Andreas during the Miocene Epoch that began 23.03 million years ago.
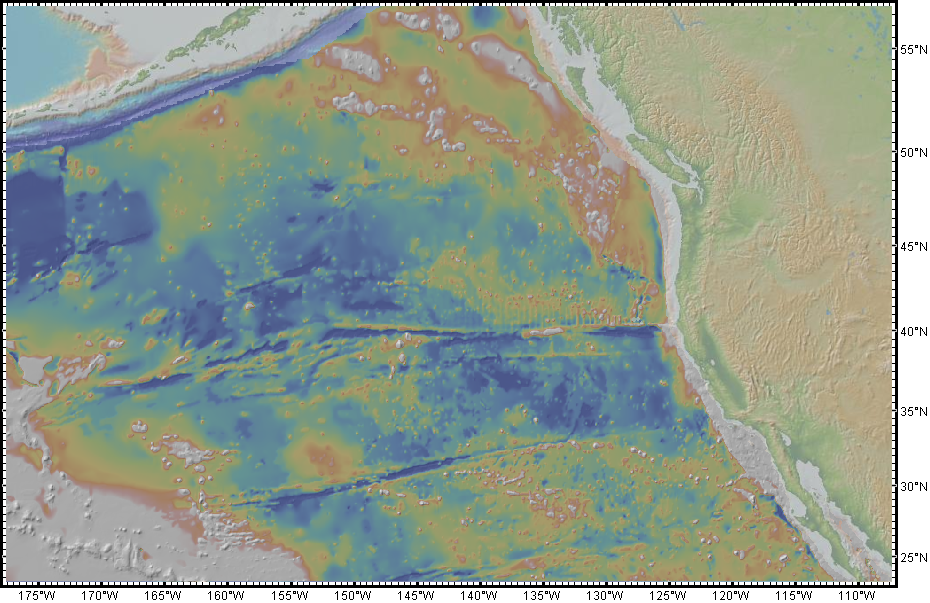
Image E. above was acquired from GeoMapApp at http://www.geomapapp.org using Ryan, W. B. F., et al. (2009), Global Multi-Resolution Topography synthesis, Geochem. Geophys. Geosyst., 10, Q03014, doi:10.1029/2008GC002332.
23.7 (Above) This is the North Pacific Thermal Boundary Model; you can see how much the decoupled plate section has cooled since it fractured and withdrew from beneath the overriding crust, leading to the formation of the Central Valley that lies directly to the east. The section contrasts to the still actively spreading seafloor to the north and south. Compare the Thermal Boundary image above to the NOAA seafloor age image F below, the same section has moved very little if any compared to the adjacent sections that have progressed during thermal contraction periods, moving over 1000 km. in what looks to be 20 million +/- years.
These images above and below illustrate better than any others how much less compression derived thermal content is in that decoupled plate section. The plate is free to move on its eastern edge that forms the San Andreas fault. It can move, as everyone is aware, a remarkable amount and as a result cannot attain the compression energy that the surrounding sections do through being subducted under a continent or buttressed against an opposing divergent boundary plate. So, we now have a metric then of how much the oceanic plates are being compressed, and by that heated.
Image F below courtesy of NOAA
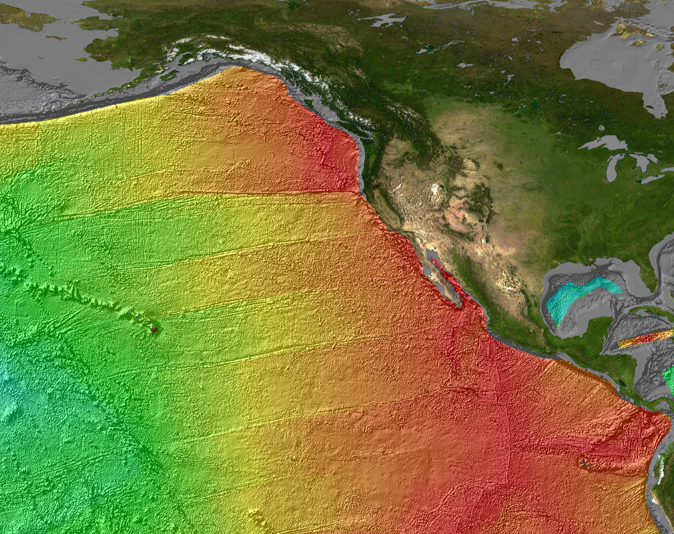
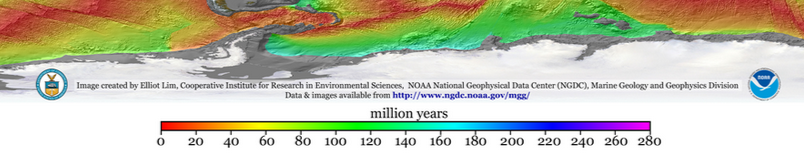
Credit for images above and below: Mr. Elliot Lim, CIRES & NOAA/NGDC, Müller -R.D., M. Sdrolias, C. Gaina, and W.R. Roest 2008. Age, spreading rates and spreading symmetry of the world's ocean crust, Geochem. Geophys. Geosyst., 9, Q04006, doi:10.1029/2007GC001743.
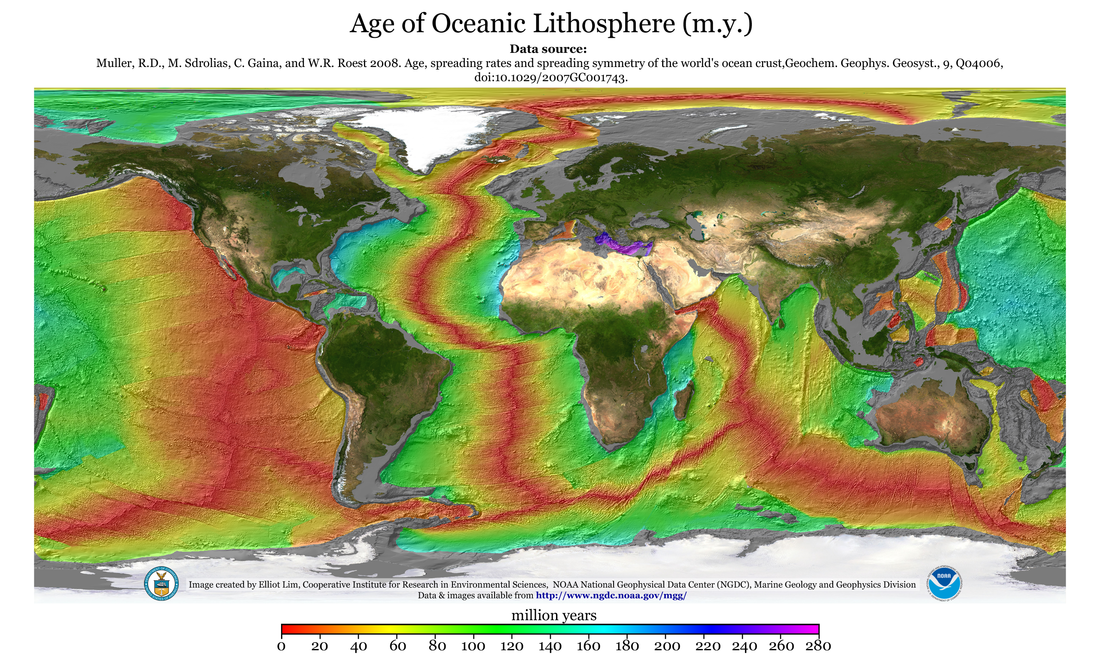
12
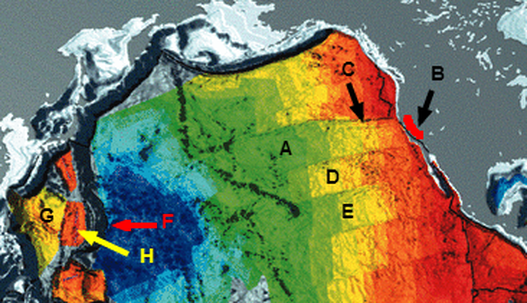
23.8 Image H. The image shows approximate seafloor ages; (G) is 40.1 – 47.9 MYA while area (H) is younger at 9.7 – 20.1 MYA, and the area (dark blue east of the Mariana Trench (F) is some of the oldest seafloor on Earth at 180 + MYA. The kinetic belt is seen as three sections of seafloor (A,D and E) separated by transition faults, the Mendocino (C) to the north of section (A), followed by in consecutive order; Murray, Molokai and Clarion to the south of (E). The Central Valley is the red oval (B). The seafloor age discrepancy reveals the historic activity of the kinetic belt sections.
Section (A) has moved appreciably less to the west since it fractured and repositioned to on top of the continent. It currently does not have the ridge infill of magma to leverage against during contraction, its current limited and redirected movement is exhibited in the San Andreas Fault complex.
It does not move at the same rate as the other sections and contributes lower energy to subduction at the convergent trenches across the Pacific. The broken eastern edge that is the San Andreas just slowly moves to the northwest as it releases its inventory of GPE.
23.9 If the Earth experienced a large thermal expansion period the broken end of the oceanic plate could end up off shore, or if the core cools long enough the plate end could end up across the Central Valley at the Sierra Nevada Mountains. As North America moves west it will gain on this and the other sections, overrunning them during contraction, probably fracturing them many times during the following expansion-contraction periods. In comparison, section (D) looks to have been progressing at a comparable rate to the other ocean crust sections, indicating it has had continuous ridge infill and or traction from the overriding N.A. Plate, leveraging the plate westward.
Though not as latent as section (A), section (E) has been less progressive than (D) indicating a slowdown of the mechanism. I think the sections show varying degrees of traction and slippage between the sections and the overriding plate. The North American plate is pushing the sections during thermal contraction, while the plate section to the south of (E) which has an active spreading center applies additional kinetic energy into section (E) during thermal contraction when the transform faults like the Clarion to the south of (E) are compressed, increasing their transfer of kinetic energy. The plate sections to the north and south of the A, D and E sections likely travel some before the compression in the plate matrix increases enough to overcome the shear resistance that sections A, D and E have to the mantle.
24.1 Death Valley (black oval) lies at the southern end of a geological trough known as Walker Lane (outlined in red), which runs north into Oregon. The crust in the Death Valley region between Lake Mead and the southern Sierra Nevada has been extended by as much as 240 km (150 miles).
The floor of the valley is currently sinking 2.54 mm a year. The actual bed rock at the spreading zone lies below 3 miles of sedimentation. This spreading center is currently active indicating the mantle is expanding at this time. In the model an expanding mantle indicates an increasing core temperature.
Base image source: Shaded Digital Elevation Model Data of Nevada, NASA
A slice through the highest and lowest points in Death Valley National Park.
Image courtesy geomaps.wr.usgs.gov
----------------------------------------------------------------------------------------------------------------- Page 33
A few images of crustal compression at work

--------------------------------------------------------------------------------------------------------------------------------------------------------------------------
24.9 Image K. This section of oceanic crust looks like it has been under repeated periods of extremely high crustal compressive load. This is the path of least resistance at its best. The compressive load from a large ocean plate with the mass of the Pacific plate can overwhelm small weak sections of surface structure like this island archipelago that occupies the now 800 kilometer (500 mi) wide passage that extends between Cape Horn and Livingston Island which is part of South Shetlands archipelago that extends from Antarctica. South America is and has been moving west while the ocean floor section has been moving east.
Image K above was acquired from GeoMapApp at http://www.geomapapp.org using Ryan, W. B. F., et al. (2009), Global Multi-Resolution Topography synthesis, Geochem. Geophys. Geosyst., 10, Q03014, doi:10.1029/2008GC002332.
25.0 This section was extruded over millions of years from the slow process of the expansion-contraction cycles at the before mentioned Challenger and Menard fractures zones that lie to the west of the islands at the Pacific Rise divergent boundary. They were offset because the west side of the ridge is dominant in allowable movement. It produces more ridge infill and pushes the ridge axis to the east. As the thermal cycles repeated, the crust to the east was compressed and then fracture in parallel east-west faults, slowly extending the section toward the islands. This, in the simplest mechanical terms, is a jack, progressively moving the faulted section to the east. The Antarctic Plate is subducting under the southern portion of the South American west coast.
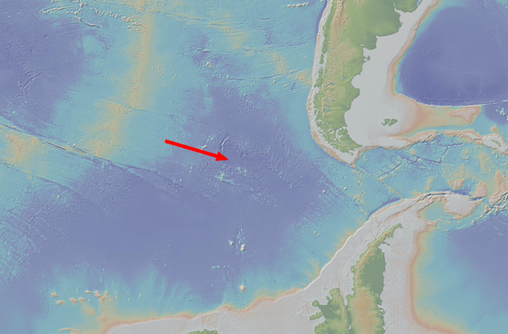
Image L. The Mass of the Pacific Plate overwhelmed the smaller Antarctic section, its mechanical advancement easily producing more kinetic energy than the Peru-Chile trench could process into the mantle. You can see the redirected crust compressing into the narrow passage, bending the continental extensions and slowly pushing the island arc out to its present position.
Image L above was acquired from GeoMapApp at http://www.geomapapp.org using Ryan, W. B. F., et al. (2009), Global Multi-Resolution Topography synthesis, Geochem. Geophys. Geosyst., 10, Q03014, doi:10.1029/2008GC002332.
25.1 The Andes are a result of the contraction process, the mantle's cooling overrunning the trenches rate of resistance. When a given subduction angle is put under extremely high compression the ocean crust produces a direction of force change of upward bending to lower the compressional strain. The high plateau of the central Andes is the result of the dissipation of this compressive energy to the path of least resistance.
The high compression at the subduction zone is what produces the large number of volcanic mountains in the orogenic belts. I think the compressional upward bending of the oceanic crust actually reduces volcanic eruptions in some volcanic vents by blocking magma flow to the vents. The areas of the Andes that have shallow subduction have been linked to inactivity. It's possible that during the periods of mantle expansion the compression is relieved and the ocean crust can retract, allowing the magma to resume venting.
The trenches of the Western Pacific began as tension fractures during thermal expansion periods. The ocean plate fractured at its weakest points, near where the continental shelf thinned and transitioned to ocean crust. The western trenches seem to stay ahead of the slow advancing continents, their back-arc basins expanding and the trenches moving in the direction of the tension force created during expansion of the oceanic crust. On the contrary, the trenches of the Eastern Pacific have been either overran by the North American continent or lie at the immediate edge of the coastlines in the Southern Hemisphere. This leads to several questions.
25.2 Why did the western trenches stay ahead of the advancing continents and the eastern trenches have been overran, or are adjacent to continents? The answer would seem to be that the lighter American continents are moving faster than the heavier Eurasian and African continent and just simply ran down the slower trenches.
The greater mass of the Eurasian and African continents has redirected the kinetic energy in the Atlantic Ocean crust to the west. That would mean the Atlantic divergent boundary would be slowly offsetting its axis to the west in relation to its orientation to Eurasia and the mantle. But the answer is also the western side of the Pacific divergent boundary was wider than the eastern side at the beginning of the Atlantic divergence. And continued getting wider, increasing its advantage and offsetting its ridge axis to the east with each thermal cycle. As mentioned before, the Farallon Plate to the east of the ridge, lost to every gain of the Atlantic. The Farallon Plate on the east side of the ridge and its trenches were reduced proportionately at every cycle to the Pacific Plate and Atlantic Ocean's gain. The Farallon Plate was reduced in a geologically compounded speed from both directions. Eventually the other eastern plates will completely be subducted with the Pacific Ridge following afterwards.
-----------------------------------------------------------------------------------------------------------------
Page 34
Summery

------------------------------------------------------------------------------------------------------------------------------------------------------------------------------------------------------------------
Earth's present-day magnetic field is much stronger than normal. The dipole moment is now 8 × 10²² amps × m2. That is twice the million-year average of 4× 10²² amps × m2. This model's rather fundamental and remarkably simple idea is easily understood with the available knowledge that the Earth's magnetic field generator's energy output does change over million year time periods, and that this slow variability would produce what is seen in the most recent observations at the Mid-Atlantic ridge;
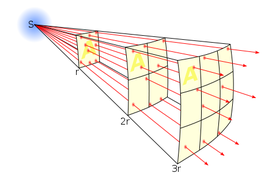
"A 20-Myr record of creation of oceanic lithosphere at a segment of the central Mid-Atlantic-Ridge is exposed along an uplifted sliver of lithosphere. The degree of melting of the mantle that is upwelling below the ridge, estimated from the chemistry of the exposed mantle rocks, as well as crustal thickness inferred from gravity measurements, show oscillations of ,3–4 Myr superimposed on a longer-term steady increase with time. The time lag between oscillations of mantle melting and crustal thickness indicates that the solid mantle is upwelling at an average rate of ,25mmyr, but this appears to vary through time."
The mutual-inductive coupling between the Sun and Earth's magnetic fields is well documented and has been shown in this study to give support to the assertion that solar magnetic induction produces a strain energy displacement of the mantle, the resultant evidence being the observed thermal content timed to plate tectonic movements.
This includes the most recent extreme solar magnetic energy level shown at left, correlated in timing and intensity to the documented record of 8.0 Japanese earthquakes seen above and that gives measure to the level of specificity that the model can provide between solar magnetic energy output and specific incidences of plate movement.
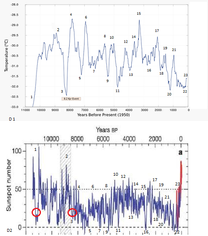
The 11,400 year long solar magnetic/climate synchronicity leave little doubt that the mutual inductive coupling of the Sun's solar magnetic generator to the Earth's own magnetic field generator is a driver of the Earth's variable climate history. From the initial warming coming out of the Younger Dryas cold period to the precise correlation of the 8.2 Kiloyear event, and the many other correlations also shown, the solar magnetic connection to climate is well supported in this study.
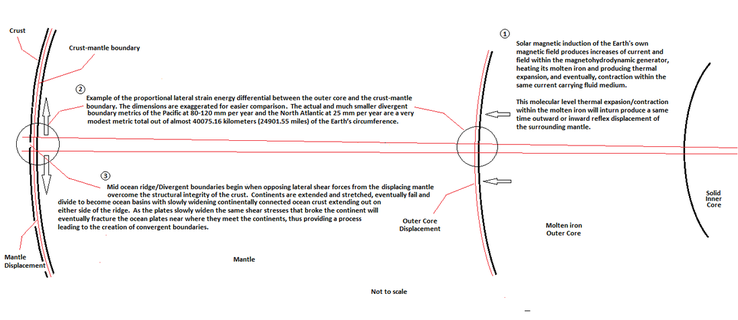
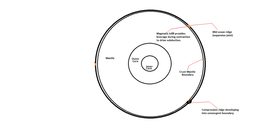
The documented mantle oscillations allow a simple process that reveals a complete model that explains how plate tectonics began and evolved into the dynamic system that is currently observed yet poorly understood by the current standard model.
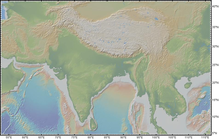
One of the most important mysteries that this model can explain is the source of the energy to move the continents, and to even raise mountain ranges when the moving land masses collide with one another. The immense gravitational potential energy needed for such events is supplied by the crust itself as it responds to the mantle's oscillations.
"The models ability to raise the global tectonic plate matrix while shoring the retreating divergent plate boundaries with new magma provides a means where the initial thermal expansion energy can be stored in the now increasingly compressed and increasingly raised mass of the crust as (short term) gravitational potential energy then slowly released as kinetic energy as the plates are driven into the asthenosphere. Periods of excessive gravitational potential energy, the periods that exceed the trenches rates of resistance will produce (long term) storage of the kinetic energy as mass in mountain complexes".
"The models ability to raise the global tectonic plate matrix while shoring the retreating divergent plate boundaries with new magma provides a means where the initial thermal expansion energy can be stored in the now increasingly compressed and increasingly raised mass of the crust as (short term) gravitational potential energy then slowly released as kinetic energy as the plates are driven into the asthenosphere. Periods of excessive gravitational potential energy, the periods that exceed the trenches rates of resistance will produce (long term) storage of the kinetic energy as mass in mountain complexes".
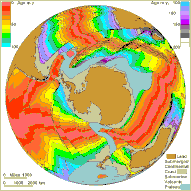
Much of this GPE is sourced from the divergent boundary infill we see in this image. These periodic deposits will provide the leverage to load the crust with a continual supply of GPE derived compression that will drive the plates into convergent boundaries and even mountain ranges if the subduction rates are unable to process the growing GPE quickly enough.

The "oscillations of ,3–4 Myr superimposed on a longer-term steady increase with time" are shown frozen in the extinct caldera tracks of the Yellowstone hot-spot extending across western N. America. At each location the crust was almost stationary as the mantle was displacing outward while the strain energy derived magma was melting through the crust and erupting from the caldera. These discharges continued until the mantle subsided again, and the divergent boundary infill produced the compression that moved the crust to the next location that was selected when the mantle's eventual and periodic outward displacement began again.
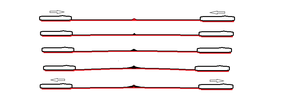
The mechanism directly responsible for the periodic movement of N. America over the Yellowstone hot-spot is simply the result of two opposing continents of the Mid-Atlantic Ridge responding to the mantle's subtle movement towards the core. A growing compression would develop in the two opposing continental/oceanic plate sections as they eventually overcome the shear resistance that the N. American continent has to moving over the Farallon Plate and then the Pacific Plate. The mantle oscillations telegraphing quite accurately the solar magnetic record that is seen in the Yellowstone caldera's movement, revealing the record of the mutual inductive coupling of the Sun to the Earth's field generating core, and the thermal expansive/contractive response that is seen in the documented "oscillations of ,3–4 Myr" of the the Mid-Atlantic Ridge.

These cycles are revealed for the first time by this model and are clearly seen in the ice core record. The smaller cycle periods are superimposed over the much larger downward trend as the mantle subsided and the crust began a period of increased compression and a concurrent globally dispersed mountain building regime that began abruptly 2-4 million years ago and coincided with the Quaternary glaciation that began 2.6 million years ago. The Quaternary continues to the present with extensive glaciation on 40,000 and 100,000 year cycles. The intervening inter-glacial periods last 10,000–20,000 years and are seen in the record to coincide with increased solar magnetic activity. The rather consistent cycle periods throughout the record would suggest and support a solar magnetic origin.
The evidence shown in this model suggests that the observed increase in ocean warming that has been widely attributed to anthropological atmospheric CO2, is actually due to a strain energy response from the slow and periodic displacement of the mantle which began with a gradual increase in activity just prior to the generally accepted end of the Little Ice Age around 1850. These sporadic pulses of thermal content moved gradually from the crust/mantle boundary into the deep ocean where it was then transported through PDO, ENSO and AMOC circulations to the surface where it then warmed the atmosphere.
The evidence shown in this model suggests that the observed increase in ocean warming that has been widely attributed to anthropological atmospheric CO2, is actually due to a strain energy response from the slow and periodic displacement of the mantle which began with a gradual increase in activity just prior to the generally accepted end of the Little Ice Age around 1850. These sporadic pulses of thermal content moved gradually from the crust/mantle boundary into the deep ocean where it was then transported through PDO, ENSO and AMOC circulations to the surface where it then warmed the atmosphere.
Please contact me and share your thoughts,
Marc Linquist - Researcher - at;
Marc Linquist - Researcher - at;