Copyright TXu 1-795-975, TXu 1-809-958,
TXu 1-823-034, TX 7-630-173 and TXu 1-852-686
TXu 1-823-034, TX 7-630-173 and TXu 1-852-686
Marc Linquist
Independent researcher at;
Independent researcher at;
Plate Tectonics: a history of a changing climate through geologic forcing.
Introduction
The purpose of this work is to explain in the most simple terms possible:
The Primary Mode of Operation of this planet.
Page 1
Geologic research is rather unique in science due to so much of what is being studied is out of range of direct observation, over the horizon so to speak. The subject phenomenon is possibly buried too deep or happened so far back in time that there are just trace amounts of evidence and the technology does not yet exist to tease out the information from what is found. So it takes a great amount of speculation to bridge the gap in knowledge, and then years of work to build up the structural evidence to slowly fill its place with sound theory.
Since that time period some fifty years ago when the theory of Plate Tectonics was widely discussed and then accepted as the cornerstone of geology, it has struggled to be integrated to the many research discoveries that have followed in its wake. And as a result of this, the "disconnect" between the theory, and the actual but still unknown mechanism that propels the lithospheric plates, has grown steadily wider over time. We have seen over these intervening years a steady issuance of questionable mechanisms in an attempt to reconcile those differences between the Theory and the actual observable world that we live on. The list of those fixes is substantial and does not need to be repeated here in total, we all have our favorites I'm sure. The many seemingly unending iterations of custom designed hypothetical mantle plumes* brings into question the current range of candidates.
And further, we must add to them the big questions that still lie unanswered, the ones that seem almost fundamentally simple, yet still out of reach. When did Plate Tectonics begin? How did it begin? How could it operate for so long without fail? How is subduction initiated? What produces mountain ranges on continental interiors?
And, the most important question of all;
What causes the movement of the lithospheric plates?
Well, that is the million dollar question isn’t it?
It seems almost hard to believe that some fifty plus years after the formalization of the plate tectonic theory there is still no concise theory of a movement mechanism that matches the many actual observations that have been made in the field by researchers over these intervening years. Theory is of course the highest level of explanatory power that a hypothetical idea can attain until some newer information comes along and those older theoretical ideas are then possibly either partially or completely falsified by these newer observations made.
Most of these suggested plate movement mechanisms are actually just considered working hypotheses, where they are open to modification as evidence comes out of research that will either support or even outright falsify that particular hypothesis. I’m going to use the term theory here in the loosest sense due to some folks’ personal opinions on the various mechanisms’ viability to the observed plate movement dynamics.
Mantle convection, or “bottom up” mantle convection as it is also known, was suggested clear back in the late 1920’s by the great Arthur Holmes as a possible driver for Alfred Wegener's theory of continental drift. Holmes wrote, “purely speculative ideas of this kind, specifically invented to match the requirements, can have no scientific value until they acquire support from independent evidence” The central idea being a convective flow in the mantle would come up and then move horizontally at the base of the tectonic plates to produce a basal drag that would tug the plates along. And it has stayed a popular mechanism of plate movement for almost 100 years now.
More recently, a “top down” or upper mantle version has gained traction since some geophysicists have doubted the deeper version’s viability;
http://www.dst.uniroma1.it/sites/default/files/doglioni/E6-15-03-13-TXT.aspx.html
MANTLE DYNAMICS AND PLATE KINEMATICS
Carlo Doglioni, La Sapienza University, Rome, Italy
Roberto Sabadini, University of Milan, Italy
". . . . . none of the proposed models of mantle convection can account for the simpler pattern in plate motion we observe at the surface, nor has a unique solution been proposed for how material in the mantle convects. At the moment there is no way to link mantle dynamics and plate kinematics at the surface, considering that the mantle and lithosphere are detached. The Atlantic and Indian ridges are in fact moving apart with respect to Africa, proving not to be fixed both relative to each other and relative to any fixed point in the mantle. This evidence confirms that ocean ridges are decoupled from the underlying mantle."
Despite this sobering revelation, deep mantle convection is still taught in schools as the standard explanation.
The top down/upper mantle version argues that the source for subduction is simply that the natural behavior of a cooling planet would be to produce a convective lid of a lithospheric plate moving from its hot beginnings at a divergent boundary, to a cooling and increased density state as it is pulled toward its eventual subduction by the sinking portion that has already moved down into the upper mantle under the convergent boundary. This is the slab-pull mechanism and is commonly used by those who support top down convection and even those that don’t. It is very popular among most geologists because of its simple concept.
One of the arguments against top down convection is that subduction initiation must begin somehow. Using the Atlantic oceanic/continental plate as an analog, the opposing oceanic plates are still connected to their parental continents. Yet the North American continent is being driven over the completely subducted remnants of the Farallon oceanic plate and is now doing the same to the Pacific. There is no down going subducted section of the Atlantic plate that is pulling it to the west with the slab-pull mechanism.
What is this enormous energy source that can not only move the Atlantic oceanic plate but can drive its connected continental section over the Pacific oceanic plates also?
Another problem with the slab-pull solution is that if an oceanic plate such as the Pacific is said to be using the slab pull mechanism, then the plate itself should be experiencing tension due to the pull force that the sinking section would be applying to the entire plate as it was being tugged towards the subduction trench. But again, the observations that usually take some years to come along after the solution has already become widely used and referenced in many research papers, show that the oceanic plates are actually in compression;
http://www-geodyn.mit.edu/zubersite/pdfs/Zuber_92JGR1987.pdf
MARIA T. ZUBER
Department of Geological Sciences, Brown University, Providence, Rhode Island
"As most of the oceanic lithosphere is in a state of net compression, the question arises as to why intraplate deformation has developed in these regions and not in others."
Another idea that is very prominent is the ridge push mechanism where the slope on the side of the mid-ocean ridge is suggested to provide enough gravity assist to overcome the drag that the tectonic plate has to the mantle and all the other plates that it is in contact with. It is often suggested that it helps the slab-pull mechanism where possible.
The actual observations though are again in contradiction to the theory;
In the research below the earlier estimates of the theorized ridge-push mechanism have been updated and seem now to have been overly optimistic and appear to suffer the same plate movement energy deficit problems that the others also have;
http://ceas.iisc.ern...h_geology06.pdf
Gravitational potential energy of the Tibetan Plateau and the forces driving the Indian plate
Attreyee Ghosh, William E. Holt, Lucy M. Flesch, A. John Haines
ABSTRACT
"We present a study of the vertically integrated deviatoric stress field for the Indian plate and the Tibetan Plateau associated with gravitational potential energy (GPE) differences. Although the driving forces for the Indian plate have been attributed solely to the mid-oceanic ridges that surround the entire southern boundary of the plate, previous estimates of vertically integrated stress magnitudes of 6–7 1012 N/m in Tibet far exceed those of 3 1012 N/m associated with GPE at mid-oceanic ridges, calling for an additional force to satisfy the stress magnitudes in Tibet. We use the Crust 2.0 data set to infer gravitational potential energy differences in the lithosphere. We then apply the thin sheet approach in order to obtain a global solution of vertically integrated deviatoric stresses associated only with GPE differences. Our results show large N-S extensional deviatoric stresses in Tibet that the ridge-push force fails to cancel."
. . . ."there is no complete dynamic explanation for this large GPE of the Tibetan Plateau and the relatively fast movement of the Indian plate. There is no apparent down going slab attached to the Indian plate that might assist in driving the plate into Eurasia through the slab pull mechanism" . . . . .
. . . . "However, the ridge push, or vertically integrated deviatoric stress magnitude, which is 3 1012 N/m (Richardson, 1992; Harper, 1975; Lister; 1975; Parsons and Richter, 1980), is not sufficient to satisfy inferred stress magnitudes of 6–7 1012 N/m that result from GPE differences between the Tibetan Plateau and the surrounding lowlands (Molnar and Lyon-Caen, 1988). An additional force is required to explain the disparity between the excess GPE of Tibet relative to that of the mid-oceanic ridges" . . . .
Conclusions;
. . "It is clear that something is missing as a driving force that does not have its source within the lithospheric shell."
So, as you can see there is usually a noticeable misalignment between the various theories and the observations that eventually come along later. They will, more often than not, contradict these “provisional” answers that will then be reevaluated or even abandoned over the course of time.
These observations are really where the “rubber meets the road” so to speak. This is where the real world either agrees with the theory or falsifies it. And as you can see these observations I’ve given are falsifying the current plate movement theories.
Sometimes though the new observations are so substantially out of alignment with the existing theory that they really indicate that there needs to be a complete paradigm shift similar to the original plate tectonic revolution some 50 years earlier, and it is now becoming more than obvious that a completely new concept of plate movement energy needs to be presented. A new theory that can more align with the many observations, that are really the actual evidence that should lead the search for the answer, instead of contradicting the older, out of date explanations, that have obviously outlived their usefulness.
I have developed such a hypothesis. It is radically different than the other ones mentioned above. But more importantly it can predict all of those observations mentioned above. What I mean is, when the model was finished and I was locating and reading newer research papers, their findings or observations that disagreed with the existing theoretical models of plate movement, subduction and mountain formation, etc., meaning they falsified them, were instead predicted by my new model of plate movement.
What I am proposing here is that our planet has within its mode of operation a thermal cycle that is the result of the planet responding to solar magnetic forcing. And, that it can explain every one of those unanswered questions mentioned above. The model will show with remarkable rigor the step by step cause and effect of this forcing, from the mutual inductive coupling of the solar and planetary field generators to the resultant cyclical thermal expansion and contraction derived displacement of the mantle and its strain energy derived thermal content at the crust/mantle boundary.
My background is in mechanical and electrical systems, so for someone of my experience, it would be a more productive process to approach this problem from a clean slate and just construct an entirely new model from scratch as if I was given the task to build a working example. A bench model so to speak. What was surprising though is when I started looking at the available research afterwards, I found that the observations were all there just as the model had predicted. I was rather shocked by these results.
I was not trained like the authors who did the original research. Instead, I'm someone who has spent much of my childhood and adult life designing and building mechanical devices of one type or another. Those research papers that I located and use to support this model were often just a single observation without any larger context to the many thousands of other ones that together formed no clear concise picture of how this planet's plate tectonic system operated.
So, it would be very difficult to sort through all of those pieces and figure out how they all went together, especially if you didn't have the correct design to reference beforehand. You have pieces that may or may not be important or even contribute to the PT system's function. Where would someone even start? It was much easier for me to imagine the most efficient and simple design based on a minimal number of components and what is already known about the Earth's structure.
So, it is my contention and the purpose of this work; to let the strongest evidence construct this new model. And further, that if one was to broadly read the available field research that has been compiled in the last 10 years or so, you would begin to understand that the evidence really doesn’t support the idea that convection can drive the tectonic plates in the manner that they have been observed to have actually moved. And even mantle plumes become unneeded and more importantly, unlikely, as newer mantle dynamics furnish clearer explanations for the former's tenuously held positions as a viable mechanism. And in fact, the research seems to be describing something completely different. So, this model is about, and focused on, what is described by these most recent observations, and even more importantly; how this model can make the most accurate predictions of observations of them.
What started to become clear as I found these research papers and read them, is that they supported one another quite well but did not support the standard model and its mantle convection mechanism (circa 1928) as the source of energy for the tectonic plate’s movement. These newest papers began to describe what is a very cyclical natural phenomenon buried within the workings of our planet’s interior. And it then became clear that this cyclical phenomenon was intimately tied to the planet’s climate and undoubtedly, somehow, the solar magnetic energy component of our Sun.
So please don’t let the volume of material dissuade you from taking a look, the idea is actually quite simple, and ironically, what is not surprising; some actually think this idea is too simple to be possible. But this is because the concept of fitting mantle convection to the surface observations has been so complicated for so long that the efforts to make convection seem viable has left many in the geologic community believing that the answers must require increasingly complex solutions that will finally predict the surface observation of the planet. But Ockham’s razor says otherwise, that this convection regime is too complicated to be the answer. It makes the theory of plate tectonics a dichotomy: on the one hand it is so complex that it can’t be modeled to a reasonable prediction of a movement mechanism, while on the other, in what seems as utter simplicity, the plate movement has maintained a remarkable consistency for possibly 3.2 billion years, including at least once, actually turning itself off and then back on again, on a whim.

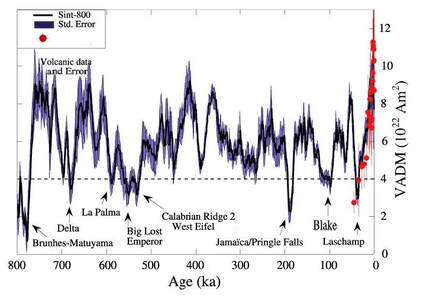
This idea in a nutshell, based on the observation of the paliomagnetic record, is that the Sun’s magnetic field generator changes in intensity over million year time scales, and that the solar magnetic field generator imposes these changes into the Earth’s own magnetic field generator. This commonly understood process as you know is called mutual inductive coupling. What is interesting is this increase and decrease in magnetic flux is proportional to the creation of current and field within the Earth’s field generator, which the evidence will show imposes molecular level thermal expansive and contractive forces on the core/outer core materials, and in turn will of course impose this displacement energy into the surrounding mantle.
Remarkable coincidence or extraordinary evidence?
Graphic above: http://www.ncdc.noaa...olanki2004.html
Unusual activity of the Sun during recent decades compared to the previous 11,000 years ; "According to our reconstruction, the level of solar activity during the past 70 years is exceptional, and the previous period of equally high activity occurred more than 8,000 years ago. We find that during the past 11,400 years the Sun spent only of the order of 10% of the time at a similarly high level of magnetic activity and almost all of the earlier high-activity periods were shorter than the present episode." Please note: The last similarly substantial energy level shown on the graph was when temperatures climbed out of the Younger Dryas cold period that previously saw a rapid return to glacial conditions in the higher latitudes of the Northern Hemisphere between 12.9–11.5 ka BP.
Graphic below: https://image.gsfc.nasa.gov/poetry/venus/Revteacher.html; The Earth's magnetic field dipole moment, a measure of the intensity of the magnetic field, is now 8 × 10²² amps × m2. which is twice the million-year average of 4× 10²² amps × m2.
So, over a period of millions of years, the Earth’s magnetic field generator and the mantle will slowly move incrementally out and then back, in sync with the solar magnetic generator's output. And of course, we would expect to see tension relieving mechanisms in the Earth’s crust that resemble the current divergent plate boundaries.
The resulting mantle displacement is central to this model and explains how this mechanism is responsible for the planet's variable climate change history and plate tectonic movement. The mantle makes up 84% of the Earth’s volume and 67% of its mass. The mass/volume differential between the mantle and the ocean is the most reveling difference between the two that in turn explains how the Earth's short and long term climate history can be driven by and timed with both plate movement and the solar magnetic energy level history.
With the mantle's mass at 67% of the Earth's total, the ocean in contrast is a mere 0.022 percent of the planet's total mass while the atmosphere weighs in at a little over a millionth or 1/1,200,000 of one Earth mass. When the mantle is displaced outward, its thickness of 2,900 kilometers, causes its outer surface area to be subjected to immense strain energy forces at scales that result not as an outward movement at the crust/mantle boundary, but as a forced lateral expansion of the mantle’s highly viscus surface area, think inverse square law, causing tearing and decompression melting of the surrounding mantle boundary surface area materials.
So, if this model was making accurate predictions then we should be able to see evidence of when the Earth’s magnetic field generating components were thermally reacting to the solar magnetic field’s oscillating flux and imposing those thermal expansive reactions into the surrounding mantle. The observations should show evidence that the mantle exhibits;
1.An oscillation regime of several million years that supports the contention that the source is derived from a solar to planetary magnetic driven thermo-elastic relay traveling through the mantle.
2.That a clear observation of a predicted mantle/crust boundary strain energy response of periodic mantle melting would be initiated and then subside through the cycle.
These very specific phenomena have been observed;
https://www.academia.edu/38174615/Mantle_thermal_pulses_below_the_Mid_Atlantic_Ridge_and_temporal_variations_in_the_formation_of_oceanic_lithosphere
Mantle thermal pulses below the Mid-Atlantic Ridge and temporal variations in the formation of oceanic lithosphere
"A 20-Myr record of creation of oceanic lithosphere at a segment of the central Mid-Atlantic-Ridge is exposed along an uplifted sliver of lithosphere. The degree of melting of the mantle that is upwelling below the ridge, estimated from the chemistry of the exposed mantle rocks, as well as crustal thickness inferred from gravity measurements, show oscillations of ,3–4 Myr superimposed on a longer-term steady increase with time. The time lag between oscillations of mantle melting and crustal thickness indicates that the solid mantle is upwelling at an average rate of ,25mmyr, but this appears to vary through time."
In the research above we can see that the mantle has an oscillating cycle lasting approximately 3-4 million years that would indicate this model is very well supported by the field observations.
A very simple interpretation of this fact is that these smaller cycle periods are just the lower energy higher frequency part of this phenomena. And, when considering the observation that this mantle thermal pulse phenomena "show oscillations of ,3–4 Myr superimposed on a longer-term steady increase with time" reveals that there is also a broader secondary wave of higher energy lower frequency phenomena connected and contributing to the plate tectonic and climate system of this planet. And that it is these wider frequency/larger energy transition periods that are very likely the geologic "moment" that there may not be any divergent boundary movement during this inward phase of the cycle. If this surprising idea can be shown to be true then these periods may actually be shown to be when the oceanic crust is loaded with the gravitational potential energy that will supply that compression in the crust that was previously described in the research paper by Maria T. Zuber.
Another interpretation and prediction by this model is that these cooler inward phases of the mantle oscillation cycle, the “The time lag“ periods, that occur between the outward portions of the “oscillations of mantle melting” when the “solid mantle is upwelling”, would allow the periodic cooling of the surrounding crust/mantle boundary areas, while of course the periods of “mantle melting” would in contrast inject a sizable thermal content into the crust/mantle boundary areas. This would thus allow this model to predict that the observations would show evidence of very regular temperature cycles in the historic paleoclimate temperature records going back through Earth’s geologic history.

Another observation is these cycle periods fit rather well to the idea that they resemble a record depicting solar magnetic cycles.

This paper also predicts and will later show using available Japanese earthquake records that the “Mantle thermal pulse” that activated the divergent boundaries at this time was far less active during the Solar Maunder Minimum, also known as the "prolonged sunspot minimum”, and was also concurrent to the time of the Little Ice Age, thus showing that the model accurately portrays the observable world by showing that solar magnetic, plate tectonic and climate phenomena are closely connected to each other in timing and intensity.
And due to the mantle's tremendous size differential, this resultant mantle melt may be small in regards to that comparison, but would none the less impose its comparative larger periodic thermal content onto the much smaller oceanic crust, ocean and atmospheric thermal content that lie immediately above it. This mechanism provides a very precise and abrupt thermal source at specific and predictable areas of the mantle's surface that will be shown to support this model's predictive abilities.
This reflex energy release will be shown to have occurred during periods of climate warming that correspond with crustal extension episodes like the Basin and Range Province and other similar and concurrent extension events from around the world, while the periodic cooling will be shown to have occurred when the mantle was subsiding and the divergent boundary infill was compressing the crust as the strain energy at the crust/mantle boundary was in decline. The observed historic periods when CO2 increased post deep ocean warming is rigorously supported by this model. Even the cause of the Paleocene–Eocene Thermal Maximum PETM can be solved!
And, remarkably, this model will show that, undoubtedly, the Earth's surface is subjected to geologic forcing in the multi-million year periodicities, as described by the research paper above, that are themselves just part of a predicted broader cycle of solar magnetic forcing that occurs approximately once every 20 - 30 million years to produce what is a surplus of compression in the crust to overwhelm the convergent boundaries normal subduction processes to produce the distinct and documented periods of mountain building activity. This model predicted these wider frequency signals a decade before they appeared in the scientific literature;
https://www.sciencedirect.com/science/article/pii/S1674987121001092
A pulse of the Earth: A 27.5-Myr underlying cycle in coordinated geological events over the last 260 Myr
Michael R.Rampino, Ken Caldeira, Yuhong Zhu
Received 13 January 2021, Revised 20 May 2021, Accepted 2 June 2021, Available online 17 June 2021.
Abstract
"We performed spectral analyses on the ages of 89 well-dated major geological events of the last 260 Myr from the recent geologic literature. These events include times of marine and non-marine extinctions, major ocean-anoxic events, continental flood-basalt eruptions, sea-level fluctuations, global pulses of intraplate magmatism, and times of changes in seafloor-spreading rates and plate reorganizations. The aggregate of all 89 events shows ten clusters in the last 260 Myr, spaced at an average interval of ~ 26.9 Myr, and Fourier analysis of the data yields a spectral peak at 27.5 Myr at the ≥ 96% confidence level. A shorter period of ~ 8.9 Myr may also be significant in modulating the timing of geologic events. Our results suggest that global geologic events are generally correlated, and seem to come in pulses with an underlying ~ 27.5-Myr cycle. These cyclic pulses of tectonics and climate change may be the result of geophysical processes related to the dynamics of plate tectonics and mantle plumes, or might alternatively be paced by astronomical cycles associated with the Earth’s motions in the Solar System and the Galaxy."
"sea-level fluctuations, global pulses of intraplate magmatism, and times of changes in seafloor-spreading rates and plate reorganizations."
Those "89 well-dated major geological events of the last 260 Myr" described above, are most likely the actual source for the vast majority, if not all, of the compressional energy being placed into the crust to drive tectonic plate movement and subduction processes. These are long periods when the solar magnetic energy waned and allowed a vast compression to build in the crust as the mantle incrementally moved down in response to an extended period of lower solar magnetic energy. The "sea-level fluctuations, global pulses of intraplate magmatism, and times of changes in seafloor-spreading rates and plate reorganizations." would soon follow when that long period of very low solar magnetic energy was suddenly interrupted with a large and extended spike of solar magnetic activity and its subsequent crust/mantle boundary thermal content and divergent boundary activity.
And of coarse these periods include the largest thermal excursion found, caused by the largest solar magnetic driven strain energy pulses and periods, the quite massive and unprecedented by any comparison, the Paleocene–Eocene Thermal Maximum PETM.
While in comparison, the majority of the mantle thermal pulse periods of 3-4 million year periodicities observed by Bonatti et al., comprise the more mundane variable thermal content that express the waxes and wanes of strain energy pulses and pauses as the mantle's surface responds to the variable solar magnetic cycle. These very mild thermal content fluctuations show themselves in our most recent interglacial period as small thermal content variations like this one we are currently in that began at the end of the Little Ice Age. And also include the Roman Warm Period, Medieval Warm Period and the more energetic and quite sudden warming spike that occurred after both the Younger and Older Dryas' cold events. We can also include the sudden stadial warming of the Dansgaard–Oeschger events whos periodicities likely extend into this inter-glacial and other interstadials that suggest, by the consistent timing of an increase thermal content, of an abrupt increase in the activity of the Atlantic Mid-Ocean Ridge. Which by the way is being perfectly modeled during this post Little Ice Age warming by the geologically sudden increase in activity at the West Antarctic Rift System.
The model predicts the simultaneous mountain building that occurred during Plio-Pleistocene, where the vertical rise of the Himalayas, Andes and many other ranges were largely completed in the last several million years when the planet cooled and the mantle incrementally subsided. And remarkably, the irregular size of the Mid-Atlantic ridge will be shown to coincide with these others and all of them together mechanistically linked to our most recent Ice Age period. All of this is supported by the most recent evidence described by this model. These predictions will be supported by multiple sources that range from solar magnetic 14C proxies, Japanese earthquake records, ice core samples, to the most recent research papers that, again, show this model predicted these observations in advance of their discovery.
This model's break from traditional Plate Tectonic theory dynamics allows it to have some novel insight into events such as the Great Unconformity and even propose its own solution to the mystery of how over a billion years worth of strata was removed from the planet's geologic record. This model's unique understanding of the observed mantle oscillations provide the mechanism that can match the observations that the main exhumation and erosion occurred when these inward phases of the mantle oscillation cycle would produce the compression in the crust that was observed by Maria T. Zuber. The model will show that as the mantle thermal pulses waned, that is, as the magnetic field energy lowers and the core complex contracts placing the crust in compression against the most recent deposits of seafloor, an increasing amount of compression will build in the crust, and will continue to build in proportion to that eventual point in time that the crust is once more subjected to another mantle thermal pulse and the divergent boundaries once again begin to separate and add more seafloor. These mantle thermal pulses allow the tectonic plates to periodically have extended periods of increased crustal compression that would provide the energy and time to raise these areas and expose them to the increased erosional processes observed in the Great Unconformity.
https://news.unm.edu/news/unlocking-mystery-of-the-great-unconformity
“This promising new ZHe thermochronology technique that Dr. Guenther helped pioneer is being tested in Grand Canyon because of the wealth of prior studies by UNM researchers and others,” said Karlstrom. “It supports the ‘young ( < 6 million) and multi-stage canyon carving’ hypothesis that we have been advocating for the last decade. At the opposite end of the geologic timescale (1.2 billion), it supports the model that John Wesley Powell's Great Unconformity is a composite erosion surface formed by several pulses of uplift.” . . . . . ."According to Thurston’s research, the main exhumation and erosion of the Great Unconformity in the eastern Grand Canyon took place around 1.25-1.35 billion years ago. This timeframe predates the break-up of the supercontinent Rodinia (550-800 million years ago)"
And of coarse the outward phase of the thermal pulse would provide the extended time and the mechanical force to break the Rodinia assembly into its smaller continental pieces;
MANTLE DYNAMICS AND PLATE KINEMATICS
Carlo Doglioni, La Sapienza University, Rome, Italy
Roberto Sabadini, University of Milan, Italy
". . . . . none of the proposed models of mantle convection can account for the simpler pattern in plate motion we observe at the surface, nor has a unique solution been proposed for how material in the mantle convects. At the moment there is no way to link mantle dynamics and plate kinematics at the surface, considering that the mantle and lithosphere are detached. The Atlantic and Indian ridges are in fact moving apart with respect to Africa, proving not to be fixed both relative to each other and relative to any fixed point in the mantle. This evidence confirms that ocean ridges are decoupled from the underlying mantle."
One can now easily imagine that the Solar magnetic field's variable energy cycle is the only logical and available driver of these mantle thermal pulses observed by Bonatti et el.
There is one more very important byproduct of these mantle oscillations and their subsequent influence on the entire planet's surface that needs to be mentioned here. These oscillations would have occurred on multi-million year periodicities that would have had a profound impact on how life eventually began and evolved during the Earth's 4.5 billion years of existence.
In what would be a profoundly simple and elegant solution to the mystery of a viable driving mechanism for evolution; these mantle oscillations would impose on the Earth's biosphere a planetary wide stress regime to stir the evolutionary pot of life.
It would be highly unlikely that any life form could have been spared from being subjected to the influence of these timely thermal, chemical and physical excursions that came from the depths below into the planet's surface environs. This model will show evidence of 56 large scale geologic excursions occurring at approximate 10 million year frequencies that would allow a predictable and consistent stimulus for natural selection. These are just the largest of many other lower energy higher frequency excursions of several million years that will be shown to have also reoccurred repeatedly over geologic time.
If by chance you would want to read a minimal amount of content and still get an idea of the model's abilities to make predictions of observations, I would suggest reading the first 8 pages and also page 22, 26, and then especially page 28 where the model can really show its abilities. The predictions that are made on page 28 are very important in that they are simply the sum of the application of this idea to some very extraordinary and as of yet unexplained observations that have been gathered in some rather extraordinary research papers.
Index
Part 1 Page 1 Introduction
Page 2 Abstract
Page 3 A model of the basic plate movement dynamics
Page 4 Direct evidence of the solar magnetic coupling to plate movement
Page 5 A simple model of dynamical possibilities
Page 6 A model of a crustal compression mechanism (Compressive Engine)
Page 7 A model for the strain energy forcing of the climate Page 8 A model for mantle driven climate variability
Page 9 Evidence of a correlated and cyclical behavior of crustal movement and climate
Page 10 Evidence that the model accurately predicts the observations of crustal behavior
Page 11 A model of seafloor dynamics
Page 12 A model of convergent dynamics
Page 13 A model for extensional dynamics
Page 14 A model of convergent boundary dynamics
Page 15 Evidence of repeated episodes of slab advance and slab retreat, slab break-off
Page 16 Prediction of double Benioff zones
Page 17 Processing of accumulated sedimentary materials at convergent margins
Page 18 A prediction of divergent boundary development
Page 19 A model of Atlantic divergent boundary dynamics
Page 20 A model for Continental breakup
Page 21 A model for the dynamic operation of the core-mantle thermal expansion mechanism
Page 22 Model of Hawaiian-Emperor Seamount Chain
Part 2
Page 23 A mechanism for producing hydraulic magma at the crust/mantle boundary
Page 24 Hotspot formation and large eruptive discharge events
Page 25 Mechanism for high speed continental movement
Page 26 Mechanism for Mountain formation
Page 27 Model for the creation, storage and distribution of: Compression and Gravitational Potential Energy within the crust
Page 28 Model for globally simultaneous boundary deformation with subsequent and significant carbon isotope excursions and mass extinctions (Evolutionary Mechanism)
Page 29 Correlation of extensional and compressional episodes to Miocene, Pliocene and Pleistocene temperature record.
Page 30 A model for Mountain ranges on Continental interiors
Page 31 A model for plate dynamics of oceanic slab break-off and relocation
Page 32 Evidence of Periodic Extension/compression Cycles in Oceanic Lithosphere
Page 33 A few images of crustal compression at work
Page 34 Summery
THE DAY BEFORE SOMETHING IS TRULY A BREAKTHROUGH, IT'S A CRAZY IDEA.
* Mantle Plume Types (http://www.mantleplumes.org/Discussion_More.html)
Thermal (1); Fossil (2); Channelled (3); Toroidal (4); Tabular (5); Depleted Residual (6); Finger-like (7); Recycled (8); Edge (9); Cold (10); Cacto- (11); Super (12); Asthenospheric (13); Dying (14); Not very energetic (15); Spaghetti (16); Baby (17); Head-free (18); Splash (19); Pulsating (20); Subduction fluid-fluxed Refractory (21); Hydrogen (22); Heterogeneous (23); Flattened Onion (24); Subduction-driving (25); Subduction-triggered (26); Washboard (27); Bent-shaped (28); Failing (29); Delamination-triggering (30); Concentrically-zoned (31); Mushroom (32); Laminar (33); Advected (34); Extinct (35); Bilateral (36); Bifurcated (37); Geriatric (38); Primary and Secondary (39); Accreted (40); Diverted (41); Deformed (42); Golden (43); Veined (44); Hidden (45); Weak (46); Pulsing (47); Young (48); Blob-like (49); Cavity (50); Starting (51); Passive (52); Stealth (53); Tilted (54); Asymmetric (55); Mega (56); Mini (57); Not-hot (58); Killer (59); Deflected (60); Stripy (61) ; Diamondiferous (62) ; Transient (63) ; Dehydrating (64); Doughnut (65); Rear (66); Side (67); Volatile-bearing (68); Incipient (69) ; Migrating (70).1 (Griffiths & Campbell, 1990); 2 (Stein & Hofmann, 1992); 3 (Camp & Roobol, 1992); 4 (Mahoney et al., 1992); 5 (Hoernle et al., 1995), 6 (Danyushevsky et al., 1995); 7 (Granet et al., 1995); 8 (Gasperini et al., 2000); 9 (King & Ritsema, 2000); 10 (Hanguita & Hernan, 2000); 11 (Lundin, 2003); 12 (Condie, 2004); 13 (Seghedi et al., 2004); 14 (Davaille & Vatteville, 2005); 15 (Michon & Merle, 2005); 16 (Abouchami et al., 2005); 17 (Ritter, 2006); 18 (Ritter, 2006); 19 (Davies & Bunge, 2006); 20 (Krienitz et al., 2007); 21 (Falloon et al., 2007); 22 (Dobretsov, 2008); 23 (Ren et al., 2009); 24 (Beccaluva et al., 2010); 25 (Burov and Cloetingh 2010); 26 (Faccenna et al., 2010); 27 (Ballmer et al, 2011); 28 (Tosi & Yuen, 2011); 29 (Kumagai et al., 2008); 30 (Camp & Hanan, 2008); 31 (Hauri et al., 2004); 32 (Tan et al., 2011); 33 (Vatteville et al., 2009); 34 (Boschi et al., 2007); 35 (Merle et al., 2011); 36 (Farnetani et al., 2012); 37 (Rohde et al., 2013) ; 38 (Zhou and Dick, 2012); 39 (Tackley, 2008); 40 (Kipf et al., 2013) ;41 (Rychert et al, 2013), 42 (Kincaid et al, 2013), 43 (Webber et al., 2013) , 44 (Bianco et al., 2013), 45 (Yang and Leng, 2014) , 46 (Yamamoto et al., 2007) , 47 (Walters et al., 2013) , 48 (Wang et al., 2013), 49 (Hanan and Schilling, 1997) , 50 (Richards et al., 1989) , 51 (Thompson and Gibson, 1991) , 52 (Chung et al., 1998) , 53 (Mittelstaedt and Turcotte, 2006) , 54 (Shen et al., 2002) , 55 (Bell et al., 2004) , 56 (Thompson and Tackley, 1998), 57 (Ernst and Buchan, 2003) , 58 (Kogiso, 2007) , 59 (Courtillot and Fluteau, 2014); 60 (Thompson et al., 1998); 61 (Cordier et al., 2016) ; 62 (Kirdyashkin et al., 2016) ; 63 (Bell et al., 2013) ; 64 (Ito, 2001) ; 65 (Gill et al., 1992) ; 66 (Mériaux et al., 2016) ; 67 (Mériaux et al., 2013); 68 (Safonova et al., 2015) ; 69 (de Quay et al., 2017) ; 70 (Oostingh et al., 2017).–Michele Lustrino
-------------------------------------------------------------------------------------------------------------------------------------------------------
Page 2
Electro Plate Tectonics
Abstract
------------------------------------------------------------------------------------------------------------------------------------------------------------------------------------------------------------------------------------------------------------------------------- "Science begins with doubting traditional textbook assertions"
– Richard Feynman
0.1 This work outlines the solution to a geological mystery. What drives the tectonic plates? The mechanical actuation of plate movement in this model is dependent of an almost undetectable, extremely slow lateral displacement in the Earth’s mantle just below the crust, that is then followed after several million years by an equally slow period of lateral contraction. The only driving force that would fit these parameters is a thermal expansion caused by an internal heat source. All thermal, mechanical and electrical systems both natural and man-made have been observed to possess variability; a rhythm, a cycle, and central to this model, oscillations. This model will show that our planet's magnetic field generator produces a small temperature rise and decline on varying time scales.
Consider the following; http://science.nasa...._magneticfield/
0.2 Dr. Gary A. Glatzmaier - Los Alamos National Laboratory - U.S. Department of Energy.
This article states that globally the magnetic field has weakened 10% since the 19th century. And according to Dr. Glatzmaier; ""The field is increasing or decreasing all the time," "We know this from studies of the paleomagnetic record."" According to the article; Earth's present-day magnetic field is, in fact, much stronger than normal. The dipole moment, a measure of the intensity of the magnetic field, is now 8 × 10²² amps × m2. That's twice the million-year average of 4× 10²² amps × m2.
0.3 It seems very unlikely that these two directional movements in magnetic energy output would not be coupled to the electric current component of the field generator. Currents can only be created by magnetic fields and magnetic fields can only create currents. If either one increases or decreases the other will move in the same direction. Current is simply the flow of electrical energy, the movement of electric and magnetic fields within and around a current conducting medium, in this case the liquid iron of the outer core and the solid iron of the inner core. The amount of thermal energy produced is directly proportional to the resistance the current encounters in the conducting medium, thus an increase in magnetic field strength will coincide with increased core temperature.
0.4 The mantle in this model is displaced by the thermal expansion of the Earth's field generating core/outer core from the increased amplitude of current within the magnetic field's magnetohydrodynamic generator. The mantle's outward movement, against the force of gravity, produces a strain energy response as the mantle's viscosity resists the expansion, creating thermal heating of the mantle material as the strain tension is released.
0.5 The strain energy response and thermal release increases proportionally to the distance from the mantle-core boundary, culminating at the crust-mantle boundary with maximum expansionary movement and strain energy thermal heating. The mantle's outer boundary surface area is stretched out and torn producing melting of the surrounding surface area materials.
Is there any evidence of the mantle displacing outward and then inward in the geologic record?
0.6 https://www.academia.edu/38174615/Mantle_thermal_pulses_below_the_Mid_Atlantic_Ridge_and_temporal_variations_in_the_formation_of_oceanic_lithosphere
Mantle thermal pulses below the Mid-Atlantic Ridge and temporal variations in the formation of oceanic lithosphere
Enrico Bonatti*†‡, Marco Ligi*, Daniele Brunelli*†, Anna Cipriani‡, Paola Fabretti*, Valentina Ferrante*†, Luca Gasperini* & Luisa Ottolini§
* Istituto di Scienze Marine, Geologia Marina, CNR, Via Gobetti 101, 40129, Bologna, Italy
† Dipartimento di Scienze della Terra, Universita` “La Sapienza”, Piazzale Aldo Moro 5, 00187, Rome, Italy
‡ Department of Earth and Environmental Sciences, Lamont Doherty Earth Observatory, Columbia University, Palisades, New York 10964, USA
§ Istituto di Geoscienze e Georisorse, Sezione di Pavia, CNR, Via Ferrata 1, 27100, Pavia, Italy
"A 20-Myr record of creation of oceanic lithosphere at a segment of the central Mid-Atlantic-Ridge is exposed along an uplifted
sliver of lithosphere. The degree of melting of the mantle that is upwelling below the ridge, estimated from the chemistry of
the exposed mantle rocks, as well as crustal thickness inferred from gravity measurements, show oscillations of ,3–4 Myr
superimposed on a longer-term steady increase with time. The time lag between oscillations of mantle melting and crustal
thickness indicates that the solid mantle is upwelling at an average rate of ,25mmyr, but this appears to vary through time."
This wonderful paper clearly shows the mantle is oscillating as this model requires.
0.7 With these revelations above we can now imagine a very simple process whereby the multi-million year increase in magnetic field strength would produce a gradual thermal expansion of the field generator's liquid iron and inner core. The mantle is then displaced in turn and the crust is then slowly displaced laterally by the displacing mantle, thus causing the world's divergent boundaries to be opened to receive fresh magma in a manner that is identical to what is currently happening at this moment at all divergent boundaries around the world.
And further, we can imagine that these oscillations of "3-4 million years" are putting in place periodic amounts of new seafloor at divergent boundaries that, as the paper above explains are; "superimposed on a longer-term steady increased with time" that reveals a variability within the phenomena that would eventually allow it to reverse direction and thus allow for multi-million year periods when the crust would develop massive amounts of gravitational derived lateral compression as the crust follows the mantle downward when the planet's magnetic field generator's output incrementally decreases.
This newest divergent boundary infill of that 27.5-Myr underlying cycle period described by Rampino et al. is now the source of this compression. The infill has now become a point of leverage and began its new role as a shoring wedge resisting the building compression in the planet's crust and forcing the tectonic plate to shift in the opposite direction, the compression bleeding away into convergent trenches and crustal folds as the world's crustal plates shift to process the slowly developing gravitational potential energy. This compression would easily produce in the crust the folding and uplift that is seen in the geologic record. And too, we can imagine the compression produced being so large that it would even provide an energy source large enough to drive numerous crustal plates deep under the edge of many others in a manner so widely observed yet is not very well explained by the current standard model.
This very simple idea will also be shown to greatly reduce the complexities that have produced so many contradictions in the various descriptions of the Earth's interior over the years. The most prevalent and contentious are those in regards to the obvious and overwhelming seismic and chemical evidence that the Earth’s interior, and more importantly, the mantle is stratified into very distinct layered regions (LVZ for example).
https://authors.library.caltech.edu/25038/122/Chapter%201.%20Origin%20and%20early%20history.pdf
New Theory of the Earth
Anderson, Don L. (2007) New Theory of the Earth. Cambridge University Press , New York. ISBN 9780521849593. http://resolver.caltech.edu/CaltechBOOK:2007.001
"Because of the combined effects of temperature and pressure on physical properties, shallow stratification may be reversible - leading to plate tectonics - while deep dense layers may be trapped at depth."
This runs counter to the specific needs of the standard model’s convection regime that would seemingly result in a “vegetable soup boiling on the stove” consistency throughout the mantle.
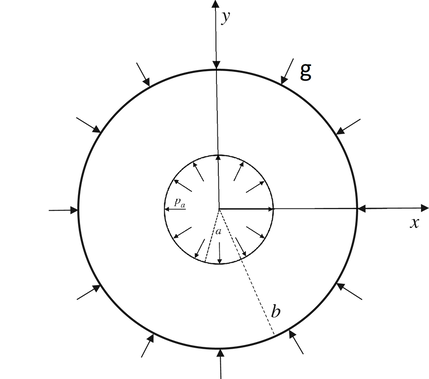
0.7.1 The very subtle mantle displacement idea of this model would produce what is already commonly observed. That in any example of a thick-walled deformable sphere that is displaced outward from within, the uneven rate of expansion between the widely spaced interior and exterior surfaces produces tremendous strain energy differentials that are manifested as lateral increases on the sphere’s outer surface area. And what is also commonly observed, is that this resulting surface tension will in turn result in material failures at specific areas of weakness. We have all seen a bulge develop in various elastic spheroid and toroidal shapes that are displaced from within.
In the mantle this outward displacement would undoubtedly result in any weaker mantle surface areas giving way under the strain, resulting in tearing, bulging, decompression melting of the mantle's surface, and the eventual weakening of the overriding crust. Largest of these examples being the rifting of continents into oceanic basins, the smallest being the periodic island building regimes that occur on a raised ocean floor anomaly such as is the case of the Hawaiian-Emperor example. The periodicity of the island chain accurately expressing the temporal history of the mantle displacements shown in Bonatti et al.above; specifically, that the individual island building regime temporally match the mantle thermal periods of 3–4 Myr.
https://authors.library.caltech.edu/25038/157/Chapter%207.%20Convection%20and%20complexity.pdf
New Theory of the Earth
Anderson, Don L. (2007) New Theory of the Earth. Cambridge University Press , New York. ISBN 9780521849593. http://resolver.caltech.edu/CaltechBOOK:2007.001
"Conventional (Rayleigh- Benard) convection theory may have little to do with plate tectonics. The research opportunities are enormous."
https://authors.library.caltech.edu/25038/122/Chapter%201.%20Origin%20and%20early%20history.pdf
New Theory of the Earth
Anderson, Don L. (2007) New Theory of the Earth. Cambridge University Press , New York. ISBN 9780521849593. http://resolver.caltech.edu/CaltechBOOK:2007.001
"Because of the combined effects of temperature and pressure on physical properties, shallow stratification may be reversible - leading to plate tectonics - while deep dense layers may be trapped at depth."
This runs counter to the specific needs of the standard model’s convection regime that would seemingly result in a “vegetable soup boiling on the stove” consistency throughout the mantle.
0.7.1 The very subtle mantle displacement idea of this model would produce what is already commonly observed. That in any example of a thick-walled deformable sphere that is displaced outward from within, the uneven rate of expansion between the widely spaced interior and exterior surfaces produces tremendous strain energy differentials that are manifested as lateral increases on the sphere’s outer surface area. And what is also commonly observed, is that this resulting surface tension will in turn result in material failures at specific areas of weakness. We have all seen a bulge develop in various elastic spheroid and toroidal shapes that are displaced from within.
In the mantle this outward displacement would undoubtedly result in any weaker mantle surface areas giving way under the strain, resulting in tearing, bulging, decompression melting of the mantle's surface, and the eventual weakening of the overriding crust. Largest of these examples being the rifting of continents into oceanic basins, the smallest being the periodic island building regimes that occur on a raised ocean floor anomaly such as is the case of the Hawaiian-Emperor example. The periodicity of the island chain accurately expressing the temporal history of the mantle displacements shown in Bonatti et al.above; specifically, that the individual island building regime temporally match the mantle thermal periods of 3–4 Myr.
https://authors.library.caltech.edu/25038/157/Chapter%207.%20Convection%20and%20complexity.pdf
New Theory of the Earth
Anderson, Don L. (2007) New Theory of the Earth. Cambridge University Press , New York. ISBN 9780521849593. http://resolver.caltech.edu/CaltechBOOK:2007.001
"Conventional (Rayleigh- Benard) convection theory may have little to do with plate tectonics. The research opportunities are enormous."
0.8 When a heat cycle is applied to plate dynamics a door is opened to the engine room of the phenomena. Simple mechanics will explain what were once thought of as complex processes, such as the Basin and Range, Island Arcs, and the Plio-Pleistocene mountain building era as well as many others. The hypothesis fits the observations so well you will see how an underlying variable heat flux cycle is the source of, and the primary mechanism for geologic phenomena that ranges from the smallest seismic tremors initiated from tension and compression forces up to the rearrangement of the planet's crustal surface. The heat energy originates in the magnetic field generator where it is created by the outer core's resistance to electrical current flow. This energy moves through expansion from the core to the mantle where it then produces in the crust the simple mechanical movement of various geologic phenomena. These geologic events such as the Basin and Range, Island arcs, convergent plate boundary trenches, divergent boundary/mid ocean ridges and the sudden mountain building of the Plio-Pleistocene era will be shown in their respective positions within planetary thermal history.
One important point to note here is that the ideas discussed here in this work are framed to directly address the failings of the Standard Plate Tectonic model, and to use all relevant research to improve Plate Tectonics and make the Theory a fully dynamic model.
Remarkably, it seems a common practice to quote only the research of the proponents of the model that the writer agrees with and supports, rather than the possibly much more useful critical analysis of its more vocal opponents. And in this vein of thought, even the harshest of opinions by even the most controversial of opponents are possibly the most useful tool in developing a complete and accurate dynamical model of plate tectonics.
Prof. Cliff D. Ollier of the School of Earth and Geographical Sciences University of Western Australia is one of the original proponents of the Expanding Earth Theory. Although that outdated idea is now completely and appropriately surpassed by plate tectonics, his more recent observations hold a wealth of useful information for critical analysis for what would be an improved plate movement model. And, it would be quite an accomplishment if this new model could persuade many of these hold outs to change there positions on this subject. Hope springs eternal.
Professor Ollier published two remarkable papers in ANNALS OF GEOPHYSICS in 2006;
A plate tectonics failure: the geological cycle and conservation of continents and oceans.
http://citeseerx.ist.psu.edu/viewdoc/download?doi=10.1.1.546.3954&rep=rep1&type=pdf
and;
Mountain uplift and the Neotectonic Period.
http://citeseerx.ist.psu.edu/viewdoc/download?doi=10.1.1.728.6975&rep=rep1&type=pdf
It cannot be overstated how insightful these two papers are and their importance in shaping what should be the accurate description of the long term method of operation of plate tectonics on this planet.
To briefly outline the two;
A plate tectonics failure: the geological cycle and conservation of continents and oceans
CLIFF D. OLLIER School of Earth and Geographical Sciences, University of Western Australia, Perth, Australia
"The rock cycle requires basalt of ocean floors and granitic rocks of the continents to be recycled. Plate tectonics explains the cycle by seafloor spreading driven by convection currents recycling basalt which re-appears at spreading sites, and subduction of sediments derived from continents to be re-incorporated in the continents. Arguments are presented that the rock cycle cannot produce new basalt for the oceans. Most continental erosion products are deposited in sites that preclude re-cycling. Quantification of erosion and uplift rates also cast doubts on the efficacy of plate tectonic mechanisms to recycle either continental or oceanic components of the Earth system."
8.5. CONCLUSIONS
"On the global scale, sediments are deposited in places where they cannot be converted to continent, and erosion should have flattened the continents long ago at present rates. Most supposed subduction sites, at island arcs or active continental margins, are located where they receive little sediment and can only subduct basaltic ocean plates. Some incredible coincidences are required to recycle basalt of the oceanic basins, and new elements remain unaccounted for. We are left with the problem that the geological cycle is not working now. Did it ever work in the past? Either the cycle concept is not valid, or we need a new model for global tectonics. The data presented here is not only a challenge to plate tectonics. I can think of no model of global tectonics – fixist, shrinking, expanding or pulsating Earth, surge tectonics, wrench tectonics or others – that can account for the problems of conservation of continents, and the cycling of oceanic basalt. I feel it is incumbent on those who postulate hypotheses of global tectonics to have at least a first approximation to the geological cycle. Plate tectonics and other hypotheses of global tectonics do not acknowledge that they fail to deal with one of the most fundamental ideas of geological science."
Mountain uplift and the Neotectonic Period
CLIFF D. OLLIER School of Earth and Geographical Sciences, University of Western Australia, Perth, Australia
"Mountains result from uplift of former plains to make plateaus, which are dissected to various degrees. There are no ‘fold mountains’. When folded rocks underlie mountains the folding pre-dates planation and uplift. The one exception is post-uplift gravity spreading of very large fault blocks. A compilation of times of uplift of mountains around the world is presented, and most show uplift in the last few million years, a time known as the Neotectonic Period. This is significant in many aspects of global tectonics, geomorphology and climate."
9.4. CONCLUSIONS
"Mountains are created by the vertical uplift of former plains, independent of any folding of the rocks underneath. The age of mountains should therefore refer to the age of vertical uplift after planation, not to the last period of folding (if the underlying bedrock happens to be folded). Most uplift occurred in the Plio-Pleistocene, or the very Late Miocene. The Neotectonic Period is demonstrated by the large amount of work listed in table 9.I. Plate tectonics, the ruling theory of the past forty years, has no adequate explanation for the widespread planation in mountain regions, or the remarkably young uplift. Indeed it is based on an association of folding and uplift that is demonstrably untrue. Plate tectonics has no plausible explanation for mountains on passive margins or continental interiors. From now on it is incumbent on those who propose models of mountain formation to do two things: − Incorporate planation surfaces into the story (or prove there was no former planation). – Either disprove the Neotectonic Period hypothesis, or show how their proposed mechanisms fit into the time scale of just a few million years."
"Either the cycle concept is not valid, or we need a new model for global tectonics."
"From now on it is incumbent on those who propose models of mountain formation to do two things: − Incorporate planation surfaces into the story (or prove there was no former planation). – Either disprove the Neotectonic Period hypothesis, or show how their proposed mechanisms fit into the time scale of just a few million years."
These are just two of the many quandaries that will be answered by this hypothesis.
-----------------------------------------------------------------------------------------------------------------
Page 3
Model of the
Basic plate movement dynamics
------------------------------------------------------------------------------------------------------------------------------------------------------------------------------------------------------------------
------------------------------------------------------------------------------------------------------------------------------------------------------------------------------------------------------------------
1.0 This model intends to show that there is a measured change in volume of the Earth’s core/outer core complex due to solar magnetic flux. This change is due to thermal expansion from a variable rate of inductance between the Earth’s and Sun’s magnetic fields.
Is there examples of mutual inductive coupling between a primary and secondary field?
http://www.igpp.ucla.edu/people/mkivelson/Publications/ICRUS1572507.pdf
"Magnetometer data from Galileo’s multiple flybys of Ganymede provide significant, but not unambiguous, evidence that the moon, like its neighboring satellites Europa and Callisto, responds inductively to Jupiter’s time-varying magnetic field."
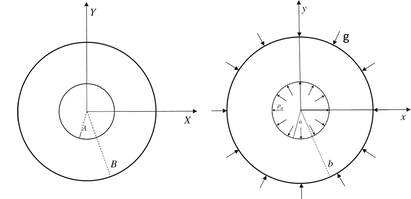
1.1 A measured thermal expansion and contraction in the Earth’s core would produce a short time frame signal, or more exact, an almost immediate response of movement in the outer mantle and crust. As the mantle displaces inward or outward from the core’s thermal expansion or contraction, the crust will respond with lateral movements of divergent boundary or convergent boundary metrics. This lateral movement in the crust will vary in each plate, based on each plate’s relative size, or more accurately, its width in relation to the plate’s direction of movement.
.
This is simply due to the plate’s proportion to the total circumference of the Earth; the plates will move a percentage of that total gain or loss of circumference based on the plate’s overall and relative metric expanse in relation to that total.
As an example of this phenomena; imagine the Earth with one single belt of oceanic crust extending around the equator with one end considered attached, immovable, while the other end is a short distance away unconnected. Now we apply the thermal increase in the field generator's liquid iron that displaces the mantle and retracts the crust away from the boundary. We can now see that the gap (A) between the plate's two ends has separated by a given degree.
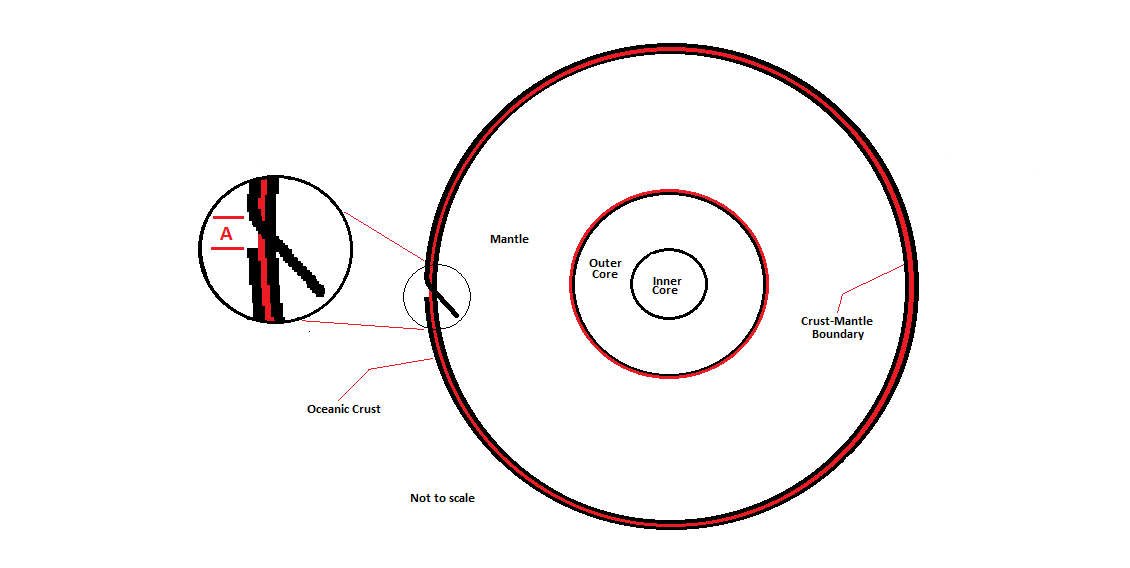
Now we all know that if the oceanic belt was divided in half and then in quarters it would with each reduction in length show a proportional reduction in movement at each additional spreading location (A), and that this proportional metric would occur even though the mantle's displacement rate is exactly the same as before. The various crustal segments will simply show their own share, or proportion, of the total mantle displacement. This means that a wider oceanic plate like the Pacific would show more movement than a narrower one like the Atlantic during any single mantle displacement episode.
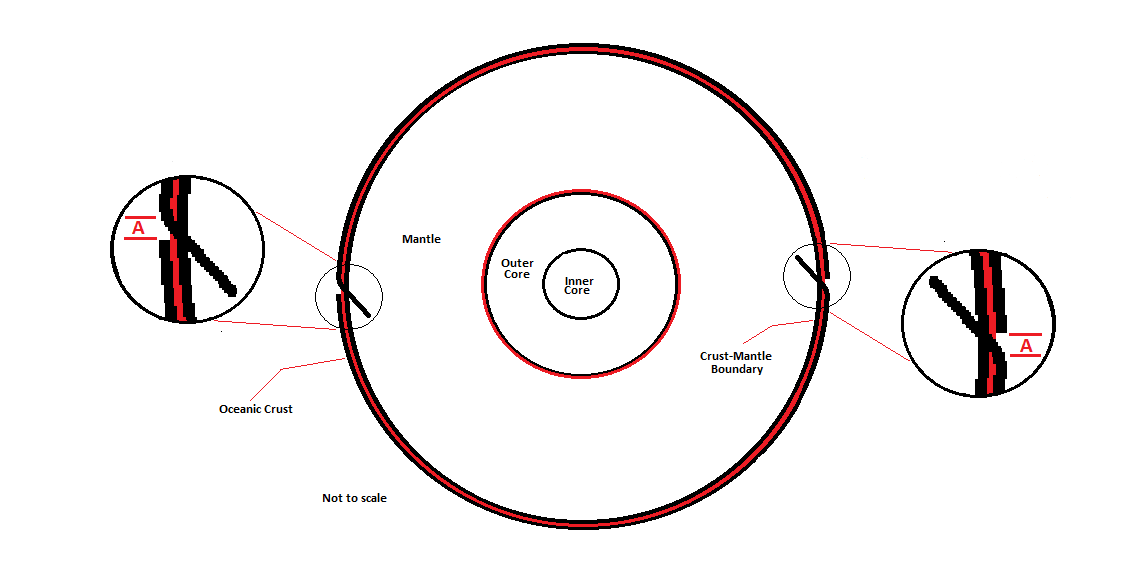
In the example above, the mantle displacement rate is divided evenly between the two spreading centers instead of all the movement happening at just one location. If one of these spreading center sections was moved and reduced to one quarter of the globe's circumference while the other section was increased to three-quarters their spreading rates would then adjust accordingly. And as this model would predict; the Pacific plate (below) having the widest expanse of plate material shows an unusually large amount of movement resulting in more infill. While the Atlantic being narrower shows a proportionally smaller amount of movement.
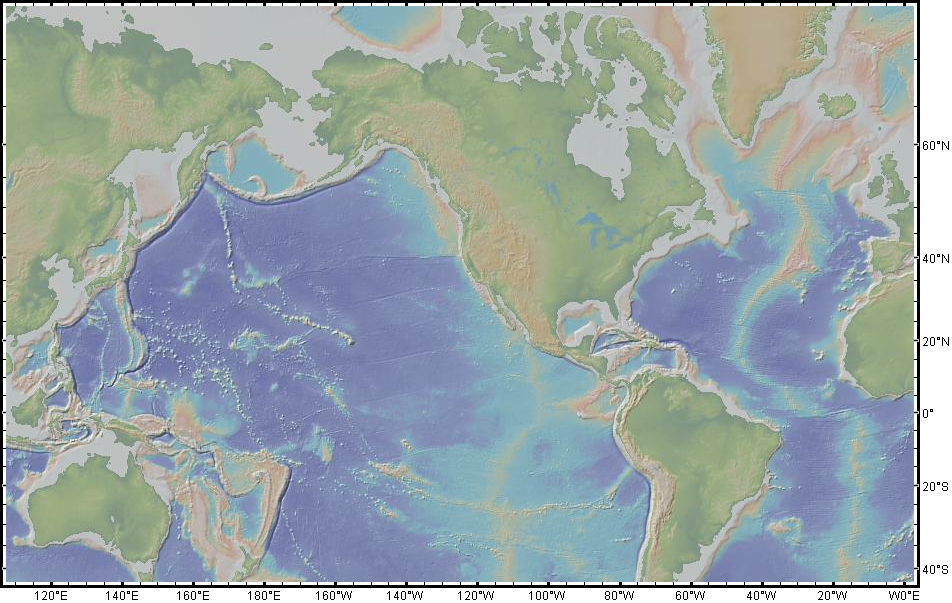
Image above and elsewhere in this work is furnished through and in no way endorsed by http://www.geomapapp.org using Global Multi-Resolution Topography (GMRT) Synthesis,
Ryan, W. B. F., S.M. Carbotte, J. Coplan, S. O'Hara, A. Melkonian, R. Arko, R.A. Weissel, V. Ferrini, A. Goodwillie, F. Nitsche, J. Bonczkowski, and R. Zemsky (2009), Global Multi-Resolution Topography (GMRT) synthesis data set, Geochem. Geophys. Geosyst., 10, Q03014, doi:10.1029/2008GC002332.
Ryan, W. B. F., S.M. Carbotte, J. Coplan, S. O'Hara, A. Melkonian, R. Arko, R.A. Weissel, V. Ferrini, A. Goodwillie, F. Nitsche, J. Bonczkowski, and R. Zemsky (2009), Global Multi-Resolution Topography (GMRT) synthesis data set, Geochem. Geophys. Geosyst., 10, Q03014, doi:10.1029/2008GC002332.
- Data doi: 10.1594/IEDA.0001000, through http://creativecommons.org/licenses/by-nc-sa/3.0/us/
1.2 And this is also why the San Andreas Fault is one of the most volatile in the world. That section of oceanic crust extends all the way across the Pacific to the Mariana Trench where it is anchored. The extreme distance multiplies the opposing divergent boundary end's movement as shown in the example above. A very small outward movement in the mantle will produce divergent boundary and fault movement proportionate to the plates distance from its trench or continental attachment point.
And this is also why there is so much seismic activity in Japan. And it is Japan that will allow this model to show a record of the change in the Sun’s magnetic field and its inductance of the Earth’s core.
And this is also why there is so much seismic activity in Japan. And it is Japan that will allow this model to show a record of the change in the Sun’s magnetic field and its inductance of the Earth’s core.
-----------------------------------------------------------------------------------------------------------------
Page 4
Direct evidence of
Solar magnetic coupling to plate movement
------------------------------------------------------------------------------------------------------------------------------------------------------------------------------------------------------------------
So, now this model must show its rigor and be used to make a prediction of observation and show that there is such a signal coming from the Earth's core complex. The parameters of this evidence are that if there was a mutual inductive coupling of the Sun and Earth; a solar magnetic energy increase would impose on the Earth's field generating core materials a thermal expansion response that would displace the mantle, and that it would in turn be expressed at the mantle's outer boundary as a timely response of plate movement. We should see evidence that a very latitudinally wide tectonic plate (Pacific) had began experiencing increased seismic energies. And, these increased seismic responses would align to a specific period when the solar magnetic proxy measurements indicate the increase in solar magnetic energy. A very specific criteria for this prediction is this signal would be most likely seen in the planet's most expansive plate widths like that of the Pacific plate where the signal will be amplified by the plate's larger proportional share of the Earth's circumference, this would of course naturally magnify the mantle's very small movement with an amplified response at the plate's margins just as a very long beam on an instrument can magnify the very small signal input being measured by that instrument.
http://pubs.usgs.gov/fs/fs-0095-00/fs-0095-00.pdf
1.3 This is a USGS graph from August 2000 showing carbon-14 content in tree rings ending in 1950 and going back in time 1,100 years. This is not a temperature proxy but a solar magnetic field energy level proxy, it is a count of the concentration, or lack thereof, of carbon-14 that has been measured in a chronological sampling of the individual seasonal rings of trees of similar growth characteristics. The tree ring content is at a specific value that is a measure of the atmospheric 14C. The 14C is a rare form of the three naturally occurring carbons, with 12C concentrations at 99%, 13C at 1% and 14C at trace amounts of 1 part per trillion that make up the total amount of CO2 in the atmosphere.
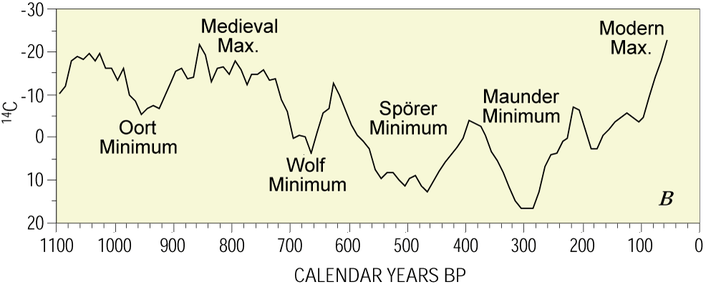
The 14C is derived from very high energy particles from space oddly named 100+ years ago as cosmic rays. The fraction of 14C in each sample relative to the other two types of carbon (12C and 13C) gives comparative measure of the Sun's magnetic field strength at that specific point in the tree ring sample's genesis.
It illustrates the level, or amount of cosmic rays that can enter the Earth's magnetic field at that given period in time. When the Sun's magnetic field is in a period of increased solar magnetic flux, the cosmic rays are deflected at the far reaches of our solar system. But when the Sun's magnetic field is weaker the particles can enter the envelope of the solar magnetic field known as the heliosphere and travel into the orbits of the inner planets including that of Earth.
For example, when the solar and planetary magnetic field energy levels eventually lower the atmospheric 14C content will thus increase, it is during these periods of lower solar magnetic energy and higher atmospheric 14C content that correlate to periods of climate cooling and conversely, it is periods of higher solar and planetary magnetic field strength that correlate to climate warming.
1.4 https://www.ncdc.noaa.gov/paleo/ctl/clisci10kb.html
Referring to the NOAA article;
"Gerard C. Bond, a researcher at the Lamont Doherty Earth Observatory has suggested that the ~1,500 year cycle of ice-buildup in the North Atlantic is related to solar cycles; when the sun is at its most energetic, the Earth’s magnetic field is strengthened."
This is the result of a mutual inductive coupling between the magnetic field's of the Earth and Sun and shows quite accurately that the Earth's climate responds to Solar magnetic forcing. This model will show in the next few pages how precise it can predict not only the correlation between solar magnetic energy levels and climate, but also Plate Tectonic movement.
The graph below is courtesy of USGS and is modified by this author.
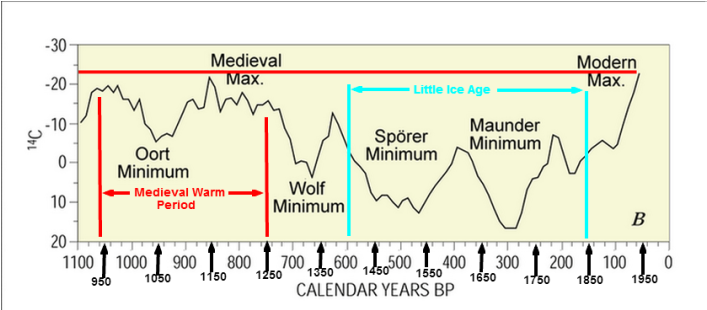
Fig.1. Above.
The graph has now been overlaid with the generally accepted boundaries of the Medieval Warm Period and the Little Ice Age, as this is the same graph that will be used here to show evidence of climate forcing by the strain energy response at the crust/mantle boundary, and that which this model proposes is responsible for both climate variability and plate tectonic movement. I have also added the standard Common Era (CE) calendar year dating system below the Before Present (BP) system for convenience.
The graph has now been overlaid with the generally accepted boundaries of the Medieval Warm Period and the Little Ice Age, as this is the same graph that will be used here to show evidence of climate forcing by the strain energy response at the crust/mantle boundary, and that which this model proposes is responsible for both climate variability and plate tectonic movement. I have also added the standard Common Era (CE) calendar year dating system below the Before Present (BP) system for convenience.

Fig. 2.
1.5 The 64 earthquakes that are listed at http://en.wikipedia.org/wiki/List_of_earthquakes_in_Japan are placed at their chronological position along the varying 14C content metric up to when the 14C data ends at 1950 C.E. The first three earthquakes (referred to as Group 1-A,B,C, at the graphs left margin) occurred prior to 900 CE and thus could not be accurately correlated to the solar magnetic data and were not considered relevant enough to include in this study.
Where the 14C proxy data runs out at 1950 C.E. the earthquakes are then continued at their chronological position at the bottom of the graph. They are so numerous by this time they must be placed vertically to fit to their date of occurrence. There was no other purpose for the observed post-1950 earthquake's almost vertical (Y axis) placement on this graph. (Although, had the solar magnetic proxy on this graph continued on the same trajectory to the present time, the earthquakes would have been continued there in a strikingly similar fashion to their vertical Y axis now seen on the graph.) Whereas the earthquakes that were placed chronologically to the pre-1950 14C proxy are placed with the intention of showing their rather specific orientation to the solar magnetic record.
The second objective here was to show that the overall increase of solar magnetic energy (as shown by 14C proxy data) starting at around the end of the Little Ice Age (1850) is concurrent to the dramatic increase in earthquake activity that soon followed. Each reference number is given a color code indicating the energy intensity listed by the source. The color key is located directly above the calendar scale date of 1850.
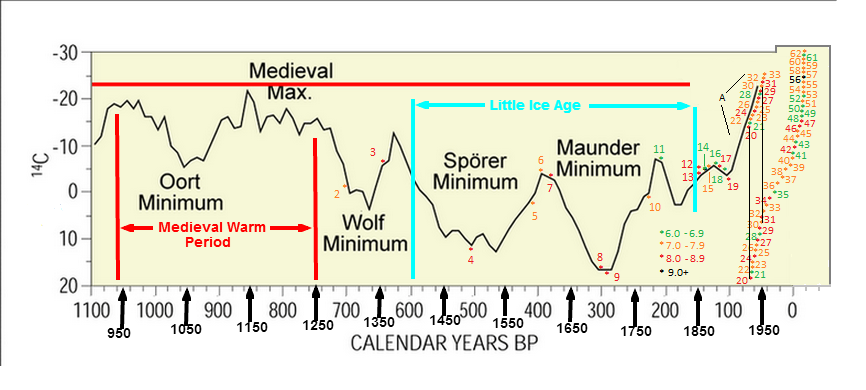
Fig. 2.
1.7 This model intends to show that a thermal expansion or contraction in the Earth’s core/outer core would produce a short time frame signal, or more exact, an almost immediate response of the outer mantle and crust. This model would expect the compression from contraction and shear forces from expansion would impose stresses at divergent and convergent boundary areas.
This model also expects these forces would show as seismic events along the Pacific plate’s boundaries. It would be likely that a seismic event would occur when the stresses from expansion or contraction changed modes. And it would also be expected that during periods of unusually high magnetic flux lasting for extended periods, as seen to the right side of the graph, it would produce a substantial and measurable increase in seismic activity as the Pacific plate is exposed to the almost continual shear stresses as the mantle slowly displaces outward.
We are fortunate that the Japanese have kept very accurate records of their seismic history. The record is listed below, each having a Graph Reference Number (GRN) corresponding chronologically to the graph. The list contains all seismic events considered to be greater than 7.0 or which caused significant damage or casualties.

1.8 Fig 2. As you can see the seismic activity is correlated very convincingly. On the right side of the graph the line moves up out of the little ice age, this is not temperature shown here, it is 14C content in tree ring samples indicating an increase in magnetic field strength. The 14C content is inverted. It is actually declining due to increasing solar magnetic flux, its content is inverted compared to the observed seismic activity seen in the Japanese records. An important point is this 14C variation is not due to any Earth bound forcing agent. The vertical rise (reduction in content) from about 1820 for example, is entirely the product of solar magnetic flux. The Sun's varying magnetic field is the only mechanism controlling 14C content and timing.
As you can clearly see the extreme solar magnetic flux activity is directly corresponding to the seismic activity, while almost all of the other events correspond to changes in the direction of magnetic flux.
1.9 As the paper above was titled and alludes to, these are Mantle thermal pulses and they directly represent the degree and tempo of the strain energy thermo/kinetic response occurring in the mantle's outer surface, and by that the crust/mantle boundary. It is the periods of excessive mantle displacement, causing tension, or the excessive compression during mantle subsidence, that produce the rapid releases of seismic energy that are seen before and after the MWP.
Remember the original graph does not show actual movement, temperature, or any other content other than solar magnetic flux shown by proxy of 14C content in tree rings. The earthquake source material from http://en.wikipedia.org/wiki/List_of_earthquakes_in_Japan only lists earthquakes 7.0 and greater, and this does not eliminate the likelihood that there was a continuous occurrence of lower than 7.0 seismic events. I have checked other sources for these events and they are not easily located. If they did not kill people and cause tsunamis they may not have been recorded.
The extreme magnetic flux shown on the right of Fig. 2 that correlates to almost continuous seismic activity can be further clarified in graph below;
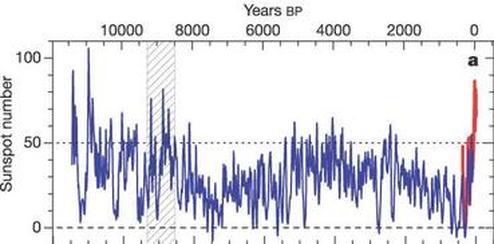
Fig. 3
2.0 http://www.ncdc.noaa.gov/paleo/pubs/solanki2004/solanki2004.html
Unusual activity of the Sun during recent decades compared to the previous 11,000 years
Nature, Vol. 431, No. 7012, pp. 1084 - 1087, 28 October 2004.
S.K. Solanki1, I. G. Usoskin2, B. Kromer3, M. Schüssler1, and J. Beer4
1 Max-Planck-Institut für Sonnensystemforschung (formerly the Max-Planck- Institut für Aeronomie), 37191 Katlenburg-Lindau, Germany
2 Sodankylä Geophysical Observatory (Oulu unit), University of Oulu, 90014 Oulu, Finland
3 Heidelberger Akademie der Wissenschaften, Institut für Umweltphysik, Neuenheimer Feld 229, 69120 Heidelberg, Germany
4 Department of Surface Waters, EAWAG, 8600 Dübendorf, Switzerland
"According to our reconstruction, the level of solar activity during the past 70 years is exceptional, and the previous period of equally high activity occurred more than 8,000 years ago. We find that during the past 11,400 years the Sun spent only of the order of 10% of the time at a similarly high level of magnetic activity and almost all of the earlier high-activity periods were shorter than the present episode.
It now seems likely, by way of the solar magnetic proxy shown in the research above, that had the solar magnetic proxy on graph Fig. 2 (below) been continued to the more recent date (2004), the earthquakes could have been positioned in a strikingly similar fashion to their current post 1950 vertical Y axis position now seen on the graph Fig. 2 (below).
This paper above clearly shows the level of specificity that can be observed in the solar magnetic record and its degree of accuracy for precise correlation to seismic events.
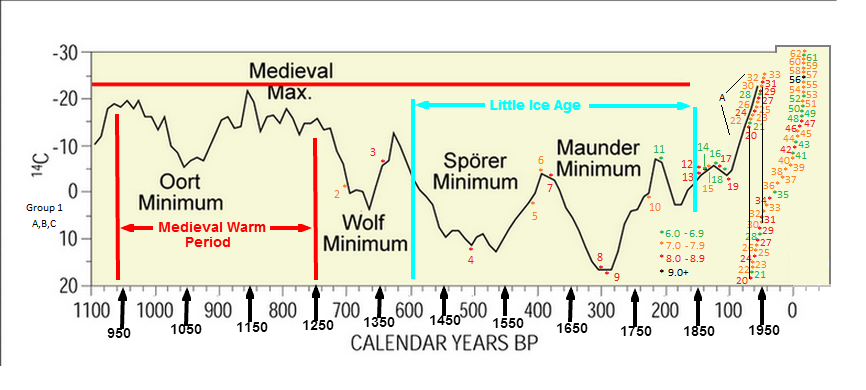
2.1 These records obtained from;
http://en.wikipedia.org/wiki/List_of_earthquakes_in_Japan
“This is a list of earthquakes in Japan with a magnitude of 7.0 or above or which caused significant damage or casualties. As indicated below, magnitude is measured on the Richter magnitude scale (ML) or the moment magnitude scale (Mw), or the surface wave magnitude scale (Ms) for very old earthquakes. The present list is not exhaustive and reliable and precise magnitude data is scarce for earthquakes that occurred prior to the development of modern measuring instruments.”
GRN 6 - 1605 AD, GRN 8 - 1703 AD, GRN 9 – 1707 AD and GRN 11 – 1792 AD, all occurred at points of major directional change of either increasing or decreasing magnetic flux. GRN 2 – 1293 AD and GRN 4 – 1498 AD occur at smaller directional changes, leaving just 3, 5, 7 and 10 occurring during minor increases or decreases in magnetic flux content.
This is remarkable that all but 4 out of the 62 documented seismic events occurred during very pronounce points of solar magnetic flux. GRN’s 20 – 62 all occur in a very compressed chronological period.
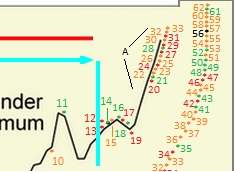
Referring to area A in the graph Fig. 2 above; there is synchronization of events 20 through 30 with the observed increasing solar magnetic energy level. Seismic event GRN 20 begins a period of chronological synchronization to the 14C proxy timeline and continues to the last 14C data at around GRN 30 at 1950.
2.2 It could be argued that the increase of these events are simply concurrent with the seismic recording work by John Milne, James Alfred Ewing and Thomas Gray, who recorded in Japan from 1880 to 1895, and the observed increase is the result of that development of recording seismic events during and following that period.
2.2 It could be argued that the increase of these events are simply concurrent with the seismic recording work by John Milne, James Alfred Ewing and Thomas Gray, who recorded in Japan from 1880 to 1895, and the observed increase is the result of that development of recording seismic events during and following that period.

Fig. 4.
I would counter this argument by examining the record with just the 8.0 earthquakes shown to have occurred in the modern seismology era. There were only five 8.0 earthquakes noted in Japanese records during the 265 years of the Edo period, on the graph they are 7, 8, 9, 12, and 13. Were these the only 8.0 earthquakes to occur during the Edo period or were they as numerous as the 11 quakes that occurred in the much shorter 164 years since 1850? Were the additional Edo records simply lost to history?
2.21 This works out to one single 8.0 earthquake every 53 years on average for the Edo period vs one single 8.0 earthquake every 15 years on average for the period that followed it to the most recent events. It would appear the Edo was by no (seismic) accident a time of great peace and prosperity.
http://en.wikipedia....istory_of_Japan
"The Edo, or Tokugawa period saw power centralized in the hands of a hereditary shogunate that took control of religion, regulated the entire economy, subordinated the nobility, and set up uniform systems of taxation, government spending and bureaucracies. It avoided international involvement and wars, established a national judiciary and suppressed protest and criticism. The Tokugawa era brought peace, and that brought prosperity to a nation of 31 million."
"In the cities and towns, guilds of merchants and artisans met the growing demand for goods and services. The merchants, while low in status, prospered, especially those with official patronage. Merchants invented credit instruments to transfer money, currency came into common use, and the strengthening credit market encouraged entrepreneurship."
"By 1800 the commercialization of the economy grew rapidly, bringing more and more remote villages into the national economy. Rich farmers appeared who switched from rice to high-profit commercial crops and engaged in local money-lending, trade, and small-scale manufacturing. Some wealthy merchants sought higher social status by using money to marry into the samurai class."
This was a developed economy, with a bureaucratic government that kept records for properties, taxes, debts, census' and every other public transaction a controlling government would administer. Banks, schools, industries and military.
2.3 http://en.wikipedia....Japan#Geography
About 73 percent of Japan is forested, mountainous, and unsuitable for agricultural, industrial, or residential use. As a result, the habitable zones, mainly located in coastal areas, have extremely high population densities.
There were 31 million people in that 27% that is the habitable area. Japan is a little smaller than Montana. That would be 31 million people in just over a 1/4 of Montana. Most all in a tsunami zone. The Japanese would be very aware of all seismic events in the 8.0 range and undoubtedly would have made note in any number of ways in multiple locations throughout Japan of any and all such destructive events.
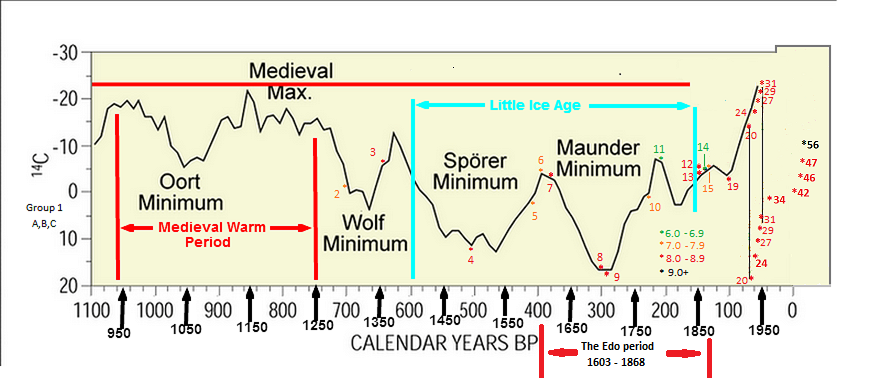
2.4 http://www.earth-pri...02Ishibashi.pdf
ANNALS OF GEOPHYSICS, VOL. 47, N. 2/3, April/June 2004
Status of historical seismology in Japan
Katsuhiko Ishibashi
Department of Earth and Planetary Sciences at Faculty of Science, Kobe University, Kobe, Japan
3. Periodization of Japanese history and historical documents
Page 345.
"During the Edo period of long-term peace and stability, economic and cultural developments of Japan created mountains of primary documents, not only in the ruling class but also among the commoners of burgeoning cities and taxed villages. These documents include official histories, records and diaries of the Tokugawa shogunate; histories, chronicles, records and diaries of 250-or-so regional lords; numerous records memoranda, letters and diaries by urban merchants and leading farmers in villages; and private writings of various kinds among the ruling warrior class."
"Because of national isolation under the Tokugawa shogunate, Japan had little contact with the West except for The Netherlands for more than two centuries during the Edo period and left behind the progress of modern science and technology. Instead however, bibliography, historiography, national and local history had been highly developed, many Ancient and Medieval documents were transcribed or published in wood-block prints, and thus rather plentiful high-quality data had been prepared for the historical research that followed the Meiji Restoration."
So we must choose whether the contemporary accounts of the Edo period earthquakes by a society of "highly developed bibliography, historiography, national and local history" became misplaced and/or outright lost and destroyed, or was this period a time of lower plate energies that were interrupted at specific and pronounce times of sudden mantle displacement driven by, and specifically timed to, the solar magnetic record.
2.5 The ANNALS OF GEOPHYSICS, VOL. 47, N. 2/3, April/June 2004, Status of historical seismology in Japan;
continued with this interesting revelation;
Page 357.
"There are, however, serious problems in these books. One is that probably the collection is not complete, especially for the Edo period. Hence, Usami, for example, is very enthusiastic in further searching for buried historical materials and publishing them."
It appears they are perplexed by the lack of records of seismic events of recordable scales. The massive earthquakes that they think should have occurred throughout this period that would be present in the records. Were they somehow lost? Or did they just not occur?
The ones that this model say should be there, are there. Located where the solar magnetic record and seismic activity occurred and correlated.
http://www.earth-prints.org/bitstream/2122/763/1/02Ishibashi.pdf
7. Some recent results of historical seismology in Japan
7.1. Recurrence history of great interplate earthquakes along the Nankai trough
Page 361.
"The 1707 Ho’ei and 1854 Ansei earthquakes took place in the Edo period causing widespread severe disasters due to strong ground motions and tsunamis , and an enormous number of records has been preserved."
2.6 That is a remarkable statement in regards to 8.0 events 9, 12 and 13 on the graph, for the 1707 and the two 1854 events, an enormous number of records were not only made but preserved to the present. Yet where are just a few of the records of those many more missing massive earthquakes that they think also occurred throughout the Edo period?
If they existed, although individually scattered around all parts of the territory like the 1707 and 1854 records, why did those records disappear en masse?
The Edo 8.0 earthquake events are few but occur where the model would predict, at times of distinct change in solar magnetic flux. I believe this is simply remarkable evidence of a direct volumetric link between solar magnetic energy levels and crustal displacement as outlined in the model. This is concurrent to the already outlined link to atmospheric forcing by strain energy and resulting production of magma at the crust/mantle boundary area.

2.8 Fig. 2 Above
2.8 This model's innovative idea and the preliminary results shown above are no doubt more than a little intriguing, but it is only the beginning of what this model can reveal about the Earth's processes. This model will explain many currently unexplained geologic phenomena, a little rise in core temperature would cause a measurable degree of thermal expansion in the outer core. It’s easy to see a mechanism for crustal volcanism and out-gassing of sulfur dioxide and carbon dioxide. Could it drive the oceanic sea floor spreading?
I believe the Earth’s core/outer core complex slowly moves in small thermal content variations over small periods extending from decades to centuries. These small periods are just low level two directional variations of larger scale cycles slowly gaining and losing thermal content in a never ending cycle of variable heat flux due to the field generator. A very small temperature rise will cause thermal expansion in the outer core, which slowly presses out the mantle, moving the mid-ocean ridges apart.
Incredibly these cycles are seen in the Earth's climate history.
http://www.giss.nasa.gov/research/briefs/hansen_15/

2.9 A large enough temperature rise will cause thermal expansion in the core/outer core complex, this thermal momentum will displace the mantle and release strain energy at the crust/mantle boundary. The core's thermal expansion energy will press out against the mantle's mass that makes up 68.4% of the Earth's total, expanding the mantle as the increasing electrical current heats the core's molten iron. The resulting displacement of the mantle, that BTW makes up 84% of the Earth's volume, moves the mid ocean ridges apart when the mantle presses out the crust. The magma is not forcing the oceanic crust at the mid ocean ridge apart. It just fills the gap caused by radial expansion of the mantle that in turn pressurizes newly created hydraulic magma, magma that by way of the mantle's outward movement displaces the crust, allowing the magma to then extrude into the slowly opening divergent boundaries.
The resulting thermal energy will dissipate into the ocean through the oceanic crust and the vast mid ocean ridge system. Eventually the outer core begins to cool and contract, initiating the mantle's return towards the core while placing the crust into a compressive load state against the new rift deposit. The crust’s compressive release is directed away from the divergent plate boundary by the most recent magma that had filled and solidified in the rift gap. The ocean crust will now slowly shift towards the opposite direction as the mantle subsides.
So this model contends that the activity at mid-oceanic ridges is of a variable content. And that the geologic activity of ridges are simply synchronized to the variation seen in that graph above. That every narrow spike seen in that graph is timed to the mid-oceanic ridges responding to the mantle being displaced by increased solar magnetic activity.
In the graph above we can see a continuous and variable cycle, but over-top of these narrow and very sharp variable cycle peaks, is the much broader and overlaying cycle of what is believed to be the results of the hypothesized Milankovitch cycles.
-----------------------------------------------------------------------------------------------------------------
Page 5
A simple model of
Dynamical possibilities
-----------------------------------------------------------------------------------------------------------------------------------------------------------------------------------------------------------------
3.0 Can this model explain the initial development and evolution of plate tectonics; the divergent and convergent boundary genesis from beginning to the current dynamics?
This model simply requires that the temperature of the core/outer core complex of the Earth's magnetic field generator will vary over million year time periods. An increase in energy will always include an increase in temperature. The temperature increase will in turn always produce thermal expansion of the core and outer core. This will displace the mantle and produce strain energy in the form of heat at the crust/mantle boundary. The slow increase in the mantle's circumference will require the crust to separate and adjust to release the continual tension.
These tension relieving mechanisms are the mid ocean ridges located where the crust could not sustain itself against the shear forces displacing it from beneath.
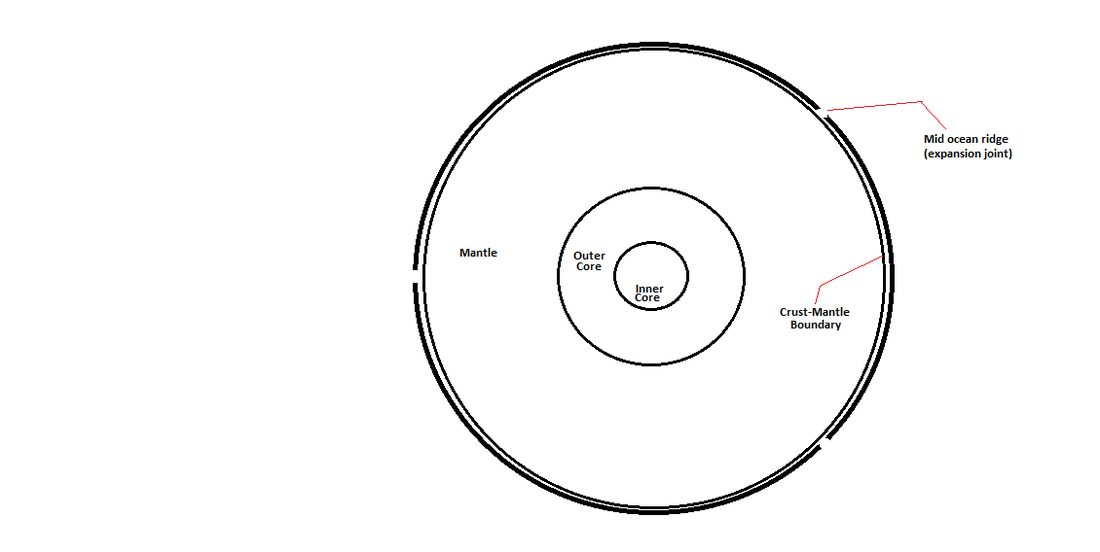
Eventually the magnetic field energy lowers and the core complex contracts placing the crust in compression against the most recent deposits of seafloor. The first subductions probably began during that time long ago when all that existed was proto crust beneath a shallower ocean. When the compression reached a critical level a compression ridge formed at one of the weaker divergent boundaries. As it failed under the increasing pressures it became a convergent boundary as one edge subducted under the other.
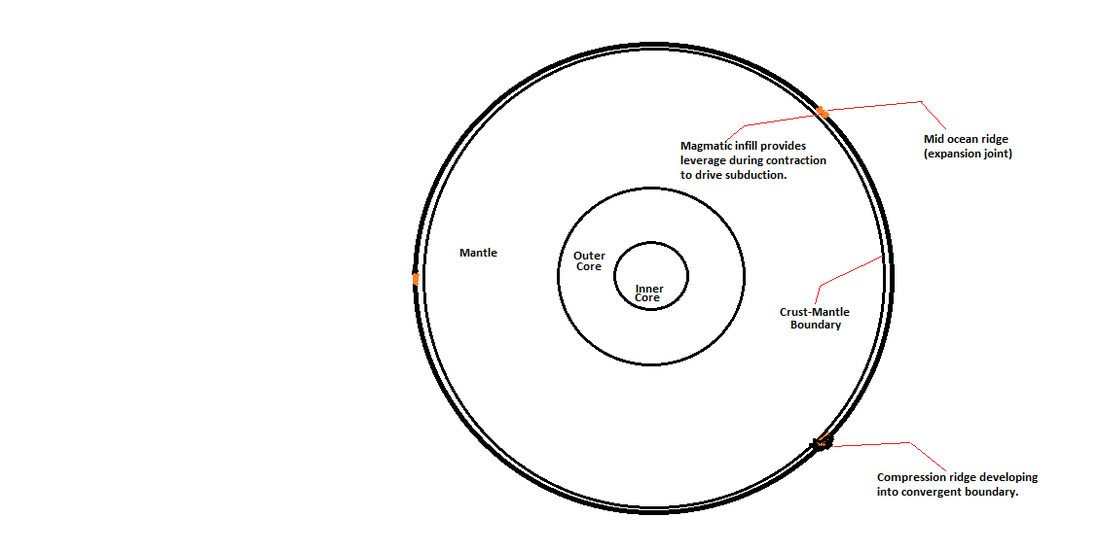
3.1 As there were no continents yet the subduction was very flat, providing the genesis for the formation of the first proto continents.
As the cycle repeated, the slow expansion added additional magmatic material into the divergent boundary now known as a mid ocean ridge. Then when the cycle changed to a cooler core/outer core the new material would leverage the opposite edge of the adjoining crust further under the overriding section.
As this cycle repeated over millions of years the areas of crust where large scale lamination of two and then three and so on layers of subducting crust had been placed would begin to press those lowest layers deeper into the mantle, farther than ever before.
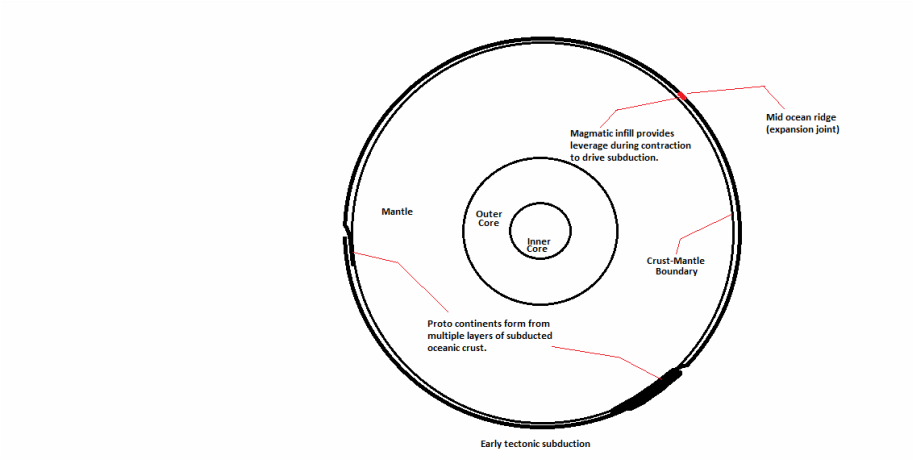
3.2 http:// en. wikipedia.org/wiki/Craton
An associated class of inclusions called eclogites, consists of rocks corresponding compositionally to oceanic crust (basalt) that has metamorphosed under deep mantle conditions. Isotopic studies reveal that many eclogite inclusions are samples of ancient oceanic crust subducted billions of years ago to depths exceeding 150 km (90 mi) into the deep kimberlite diamond areas. They remained fixed there within the drifting tectonic plates until carried to the surface by deep-rooted magmatic eruptions.
If peridotite and eclogite inclusions are of the same temporal origin, then peridotite must have also originated from spreading sea floor ridges billions of years ago, or from mantle affected by subduction of oceanic crust. During the early years of Earth's existence, when the planet was much hotter, greater degrees of melting at spreading oceanic ridges generated oceanic lithosphere with thick crust, much thicker than 20 km (12 mi), and a highly depleted mantle. Such a lithosphere would not sink deeply or subduct, because of its buoyancy and the removal of denser melt that in turn increased the density of the residual mantle. Accordingly, cratonic mantle roots are probably composed of buoyantly subducted slabs of a highly depleted oceanic lithosphere.
3.3 The greater depth and heat in combination with whatever water and minerals that were brought with the crust were processed into gradually more complex petrologic examples. These first layers of ocean crust that were raised from below out of that ancient ocean have long since eroded away as the newer igneous rocks came up under them from the depths below.
We can now imagine the idea that subduction is possibly a forced process instead of a passive one. And that basalt would actually find it difficult to sink into a dense solid-state material such as the mantle. That the crust is instead driven under continents, layer by layer where it is metamorphosed with other subducted materials into granite and other more complex mineral varieties and melts. This would satisfy a major portion of Professor Ollier's "problems of conservation of continents". In that the mantle's density allows the continental crust to respond to its isostatic equilibrium, just as it does when ice sheets melt during an inter-glacial. But this time the continent is slowly rising because it is responding to the erosional processes that wear down its exposed surfaces.
We would need evidence of this layered mode of subduction.
https://www.iris.edu/hq/NSFProposal/Volume2/Lith.pdf
Lithospheric Layering in the North American Craton
Huaiyu Yuan (Berkeley Seismological Laboratory),
Barbara Romanowicz (Berkeley Seismological Laboratory)
"Recent receiver function studies detect structural boundaries under continental cratons at depths too shallow to be consistent with the lithosphere-asthenosphere boundary (LAB) as inferred from seismic tomography and other geophysical studies. Using the new results from our regional surface wave tomographic inversion for the North American upper mantle shear wave structure, we show (Figure1) that changes in the direction of azimuthal anisotropy with depth reveal the presence of two distinct lithospheric layers throughout the stable part of the North American (NA) continent [Yuan and Romanowicz, 2010]."
. . . . ."American craton may be exceptionally simple, the application of this tool to other continents should provide further insights on the assembly and evolution of cratons worldwide."
The Great Unconformity would be a predicted result of this forced layered subduction that would be produced by the observed pulses of crustal displacement.
https://news.unm.edu/news/unlocking-mystery-of-the-great-unconformity
“What ties these findings together is that great erosion surfaces that are forming today in the Colorado Plateau and that also beveled the North American continent in the distant past to a flat-lying near sea level continent like Australia is today—take place in pulses of continental uplift driven by the ups and downs caused by distant plate tectonic events.” . . . . .
“It supports the ‘young ( < 6 million) and multi-stage canyon carving’ hypothesis that we have been advocating for the last decade. At the opposite end of the geologic timescale (1.2 billion), it supports the model that John Wesley Powell's Great Unconformity is a composite erosion surface formed by several pulses of uplift.” . . . . . ."According to Thurston’s research, the main exhumation and erosion of the Great Unconformity in the eastern Grand Canyon took place around 1.25-1.35 billion years ago.
It would only take an increased quantity of divergent boundary infill from a longer and/or stronger than usual solar magnetic increase to initiate this period of geologic exhumation. A group of mantle thermal pulses in a series that could simply raise the surface to the higher elevations that promoted the increased rate of erosion.
3.3.1 The more complex tectonic processes that are now observed today rely still on the simple magnetic field generator thermal cycles described above. The continents have evolved into cratonic structures that are still built, moved and destroyed by the simple mechanism that the model provides.
The “key” to subduction in our contemporary geology can be deduced by carefully examining the observable evidence.
The Atlantic oceanic plates are connected to their adjoining continents. We are rather certain that the continents in question were once joined, so we have a rather good analog to compare other plates against.
The Pacific plate is no longer connected to its parental continent, and we could expect that a model that can explain why the Atlantic has not separated (yet) and why the Pacific has separated would be making predictions of observation quite well.
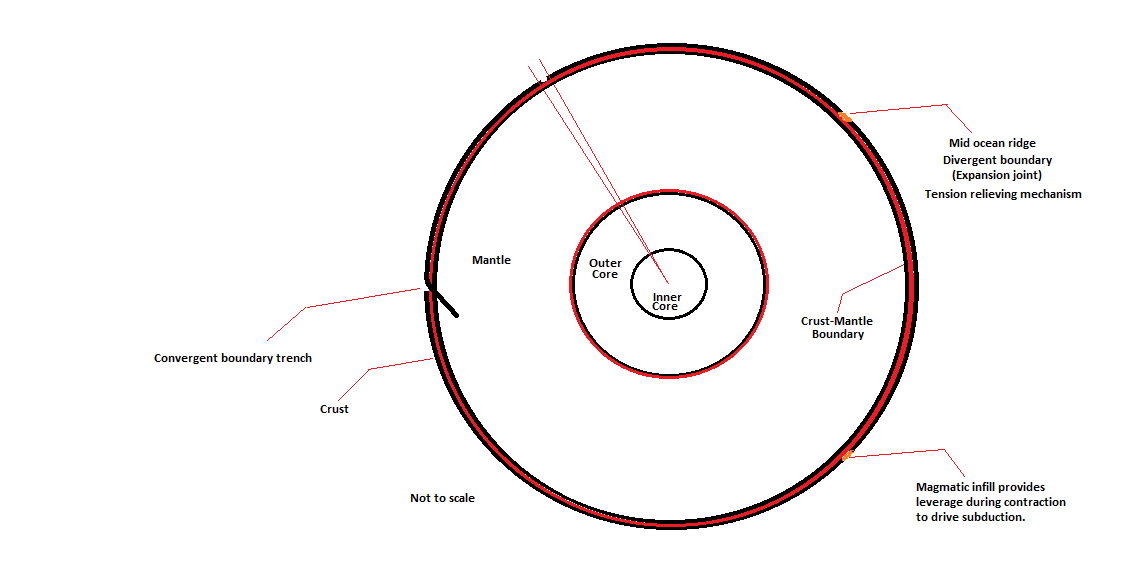
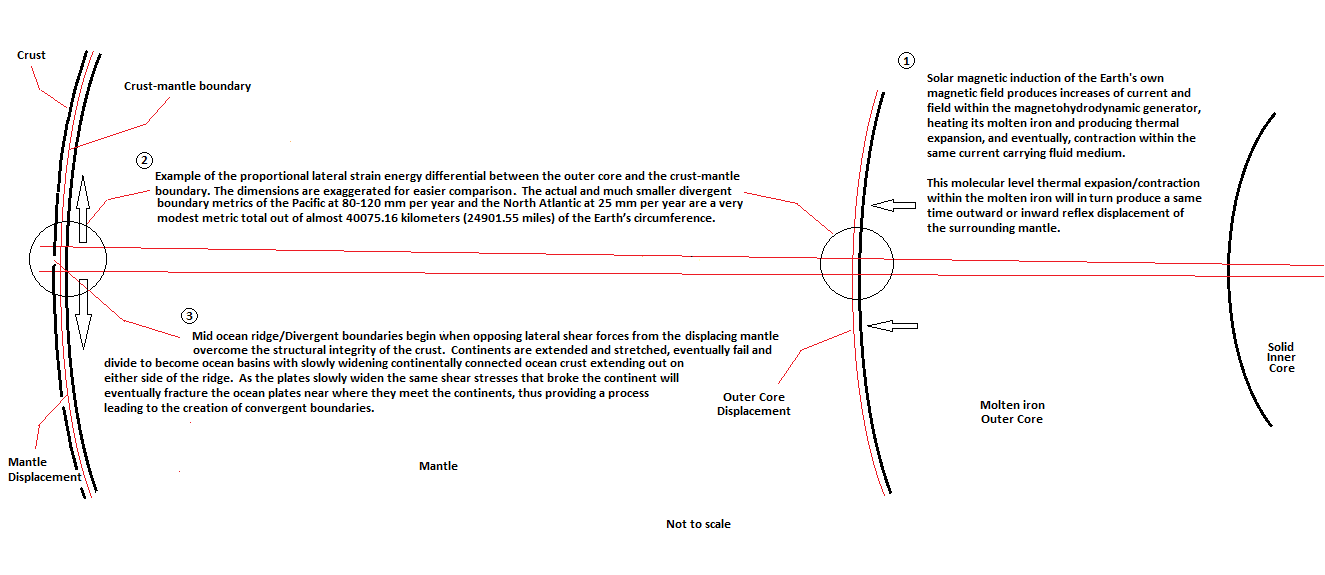
3.3.1.2 In the cartoon above we can see that the creation of a convergent boundary is simply the inevitable result that occurs when the mantle thermal cycle changes from an outward displacing mode to an inward subsiding mode. First, from a period of outward mantle displacement that is capable of applying enough shear force to break a plate section away from the continental attachment to create a divergent boundary. And then when the mantle is subsiding, changing to a convergent boundary as the two plate sections are now forcibly driven into each other until one yields and is subducted under the other.
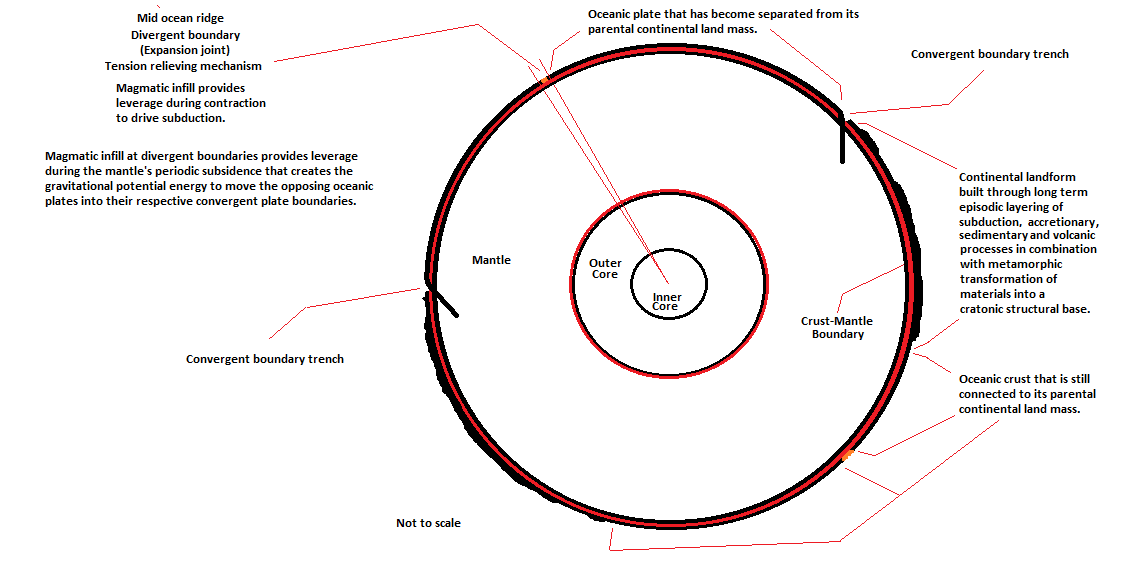
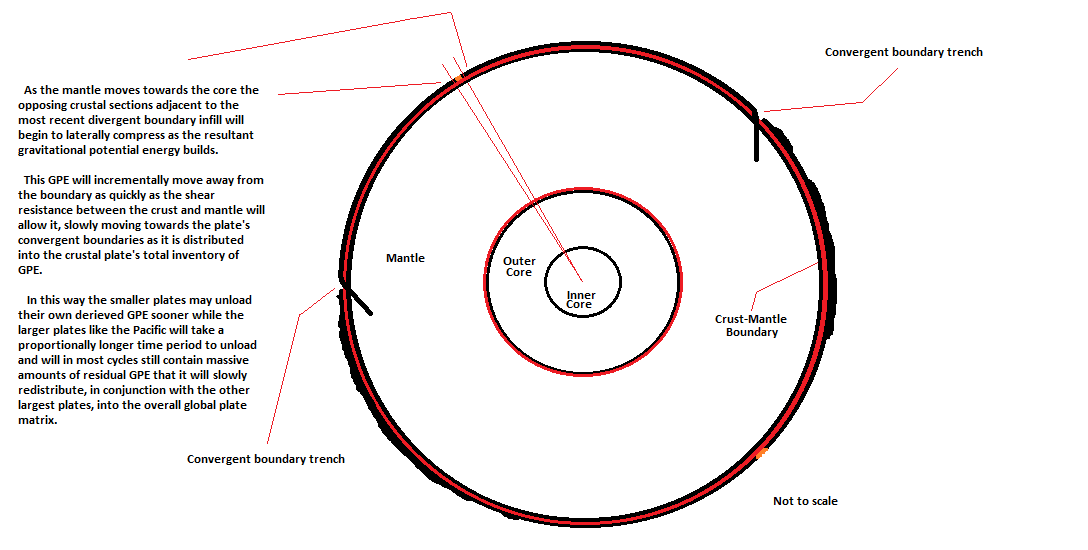
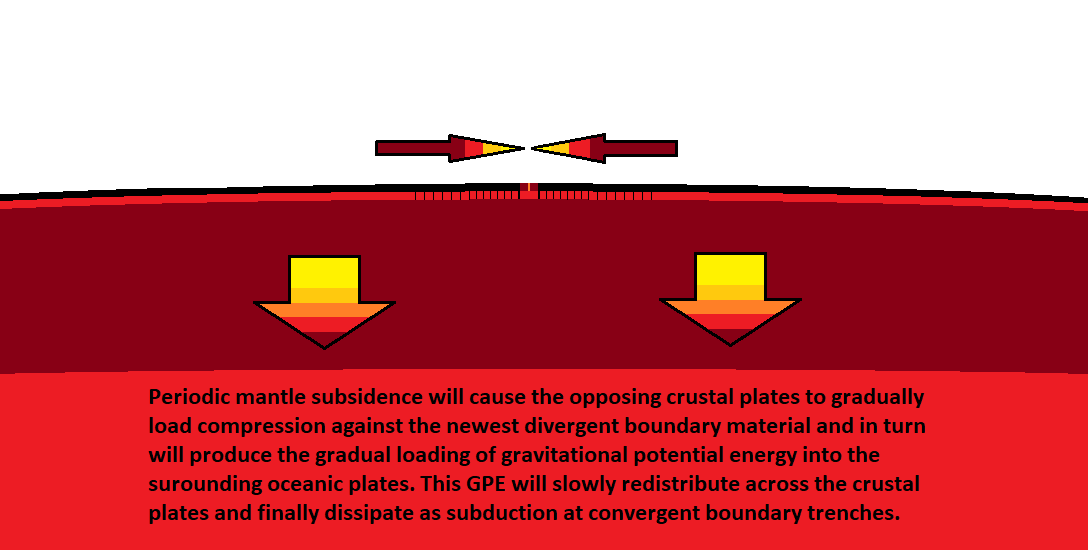
-----------------------------------------------------------------------------------------------------------------
Page 6
Model of
Crustal compression mechanism
(Compressive Engine)
-----------------------------------------------------------------------------------------------------------------------------------------------------------------------------------------------------------------
The Himalayas are currently rising and that would seem to be counter-intuitive to any idea claiming that you could have a period of increased Solar magnetic energy (as we currently do) producing a slowly displacing mantle that could be separating the mid-ocean ridges in the currently observed manner.
This model can explain how these two could be occurring simultaneously.
One of the biggest clues is that the oceanic plates are currently under compression. This is some of that newer research that the old model cannot contend with.
http://www-geodyn.mit.edu/zubersite/pdfs/Zuber_92JGR1987.pdf
MARIA T. ZUBER
Department of Geological Sciences, Brown University, Providence, Rhode Island
"As most of the oceanic lithosphere is in a state of net compression, the question arises as to why intraplate deformation has developed in these regions and not in others."
This compression is the result of a vast amount of Gravitational Potential Energy GPE that is required to raise those Himalayas. The GPE is vastly more than the most recent calculations of the standard model's ridge push mechanism can provide.
http://ceas.iisc.ern...h_geology06.pdf
Gravitational potential energy of the Tibetan Plateau and the forces driving the Indian plate
Attreyee Ghosh, William E. Holt
Department of Geosciences, State University of New York, Stony Brook, New York 11790, USA
Lucy M. Flesch*
Department of Terrestrial Magnetism, Carnegie Institution of Washington, Washington, DC 20015, USA
A. John Haines†
Bullard Laboratories, University of Cambridge, Cambridge CB3 0EZ, UK
ABSTRACT
"We present a study of the vertically integrated deviatoric stress field for the Indian plate and the Tibetan Plateau associated with gravitational potential energy (GPE) differences. Although the driving forces for the Indian plate have been attributed solely to the mid-oceanic ridges that surround the entire southern boundary of the plate, previous estimates of vertically integrated stress magnitudes of 6–7 1012 N/m in Tibet far exceed those of 3 1012 N/m associated with GPE at mid-oceanic ridges, calling for an additional force to satisfy the stress magnitudes in Tibet. We use the Crust 2.0 data set to infer gravitational potential energy differences in the lithosphere. We then apply the thin sheet approach in order to obtain a global solution of vertically integrated deviatoric stresses associated only with GPE differences. Our results show large N-S extensional deviatoric stresses in Tibet that the ridge-push force fails to cancel."
. . . ."there is no complete dynamic explanation for this large GPE of the Tibetan Plateau and the relatively fast movement of the Indian plate. There is no apparent down going slab attached to the Indian plate that might assist in driving the plate into Eurasia through the slab pull mechanism" . . . . .
. . . . "However, the ridge push, or vertically integrated deviatoric stress magnitude, which is 3 1012 N/m (Richardson, 1992; Harper, 1975; Lister; 1975; Parsons and Richter, 1980), is not sufficient to satisfy inferred stress magnitudes of 6–7 1012 N/m that result from GPE differences between the Tibetan Plateau and the surrounding lowlands (Molnar and Lyon-Caen, 1988). An additional force is required to explain the disparity between the excess GPE of Tibet relative to that of the mid-oceanic ridges" . . . .
. . . ."Lithospheric density variations associated with the support of the high topography of the Tibetan Plateau give rise to lithospheric body forces and hence stresses. Although the sources of stress that drive plate motions have been ascribed to many parameters (Forsyth and Uyeda, 1975), from the point of view of stress continuity and force balance, the stresses that drive lithospheric motion arise from two sources: (1) gravity acting on density variations within the lithospheric shell on Earth, and (2) gravity acting on density variations deeper than the lithospheric shell. The latter gives rise to tractions (radial and tangential) that act on the base of the lithosphere, affecting the stress field of the lithosphere and producing dynamic topography.The former involves density variations associated with support of nondynamic components of topography".
Conclusions;
. . "It is clear that something is missing as a driving force that does not have its source within the lithospheric shell."
So, pretty interesting isn't it! The mid-ocean ridges are moving apart while we are in a inter-glacial warm period, yet the Himalayas are rising, and there is massive compression in the crust that no one knows how it got there.
It is important to note here that the Standard Model has no answer for this massive GPE shown above. And in what seems as a complete disconnect from the observations shown here, the Standard Model's current favorite driver of plate movement, Slab Pull, would only provide tension in the crust instead of the observed compression.
The way this works is;
3.31 For the last several decades the global network of geodetic stations has allowed us to determined that the relative motions of thousands of points on the planet's surface has shown that the net motions add up to zero for any global circuit. All of the observed tectonic plate domains that are semi-rigid and separating, are matched by other domains which are converging.
It would then be most critical to any plate movement model to incorporate these facts into its description of operation. This model is dependent on a tremendous shear resistance between the crust and mantle that moderates the distribution of the compression that slowly moves away from its source at divergent boundaries to its final disposition at a convergent boundary. This is in part due to the isostatic equilibrium that is distributed at much lower values due to the compression that is now present in the global plate matrix.
For example, the Himalayas should not be anywhere close to the height that they are at. They should be sinking into the mantle at this moment. But, this model can explain this paradox by explaining that the Earth's entire plate matrix is, to some degree, being held in a compressive load state by its shear resistance to the mantle.
3.32 Imagine how compression alone can hold a long series of unmortared bricks in suspension without falling. Now if these were instead massively wide plates lying over a planetary sphere we have an idea how the immense shear resistance could hold a compressive bias in the entire planetary plate matrix.
http://www-geodyn.mit.edu/zubersite/pdfs/Zuber_92JGR1987.pdf
MARIA T. ZUBER
Department of Geological Sciences, Brown University, Providence, Rhode Island
"As most of the oceanic lithosphere is in a state of net compression, the question arises as to why intraplate deformation has developed in these regions and not in others."
3.33 In this model the compression that resides in the crust at this moment is much older than the mantle displacement period that is currently taking place. The compression that is in the crust right now could be referred to as fossil compression, being that it is supplied by residual or "fossil" gravitational potential energy in the crust that was produced over the last several million years as the mantle began to cool and subsided in the Miocene that in turn caused the crustal compression during the Pleistocene and Pliocene periods and produced in the crust many of the massive mountain ranges around the world that rose up so quickly during that time period.
https://agupubs.onlinelibrary.wiley.com/doi/abs/10.1029/2022GL097937?af=R&utm_source=miragenews&utm_medium=miragenews&utm_campaign=news
Evidence for a Global Slowdown in Seafloor Spreading Since 15 Ma
Colleen A. Dalton,Douglas S. Wilson,Timothy D. Herbert
First published: 25 March 2022 https://doi.org/10.1029/2022GL097937 Citations: 1
Abstract
“The rate of ocean-crust production exerts control over sea level, mantle heat loss, and climate. Different strategies to account for incomplete seafloor preservation have led to differing conclusions about how much production rates have changed since the Cretaceous, if at all. We construct a new global synthesis of crust production along 18 mid-ocean ridges for the past 19 Myr at high temporal resolution. We find that the global production rate during 6–5 Ma was only 69%–75% of the 16–15 Ma interval. The reduction in crust production is mostly due to slower seafloor spreading along almost all ridge systems. While the total ridge length has varied little since 19 Ma, some fast-spreading ridges have grown shorter and slow-spreading ridges grown longer, amplifying the spreading-rate changes. Our production curves represent a new data set for investigating the forces driving plate motions and the role of tectonic degassing on climate.”
"We find that the relative plate speed at almost all divergent plate boundaries has slowed down, with a major inflection point at 15–16 Myr. As a result, the rate at which new ocean crust is created also slowed down, by roughly 35%. We speculate that there is not a single explanation for the nearly global slowdown in plate speeds but rather several unrelated tectonic events, such as the emergence of the Andes."
Well, yes there is a single explanation for the global slow down in plate speeds.
This process then, that produces this residual and periodic supply of compression in the crust, could be described in the mechanical terms of a reciprocal compressive engine, or even terms describing a mechanically driven gravity actuated drive. This mechanism allows the newest divergent boundary infill to supply a means to periodically advance the plate into a state of compression that ultimately will end in a convergent trench. The plate first being loaded at the divergent boundary when the mantle moves down, and then during the following period of low activity this very laterally concentrated load of compressive energy will slowly redistribute across the plate, and will be largely distributed into, and added with, the overall crustal matrix when the mantle will once again slowly displace outward and again adds another boundary infill for the next round of compression.
This process has thus supplied the crust with a net plus of compression, which currently allows us to observe the divergent boundary metrics to be in balance with the convergent boundary metrics, as is shown in the geodetic measurements, all the while holding and keeping the world's mountain ranges from sinking into the mantle.
What does plate movement look like at the transition periods where plate energies wind-down to at or near 0 and the solar magnetic energy comes back up suddenly to levels that in this case go far beyond just activating or re-activating a divergent boundary, but instead goes much further and produces basaltic magma province size eruptions like those that began forming at the beginning of the Atlantic oceanic basin?
https://www.science.org/doi/10.1126/sciadv.abo0866
Reduced plate motion controlled timing of Early Jurassic Karoo-Ferrar large igneous province volcanism
Micha Ruhl, Stephen P. Hesselbo, Hugh C. Jenkyns, Weimu Xu., Ricardo L. Silva, Kara J. Matthews, Tamsin A. Mather, Conall Mac Niocaill, And James B. Riding
SCIENCE ADVANCES
9 Sep 2022
Vol 8, Issue 36
DOI: 10.1126/sciadv.abo0866
Abstract
"Using global plate reconstruction models and Lower Toarcian sedimentary mercury (Hg) concentrations, we demonstrate (i) that the T-OAE occurred coevally with Karoo-Ferrar emplacement and (ii) that timing and duration of LIP emplacement was governed by reduced Pangean plate motion, associated with a reversal in plate movement direction. This new model mechanistically links Earth’s interior and surficial processes, and the mechanism is consistent with the timing of several of the largest LIP volcanic events throughout Earth history and, thus, the timing of many of Earth’s past global climate change and mass extinction events."
"The Siberian Traps, the Karoo-Ferrar, the North Atlantic Igneous Province, and the East African Rift LIP regions all show a substantial reduction in local plate velocities and an associated reduction in local total plate movement in the millions of years leading up to LIP emplacement"
So, we can see in the paper above the plate movement of this model describes and predicts the conditions described in the just published research where the GPE in the crust is dispersing to the point of cessation of plate movement in one specific direction several million years before the initiation of a plate movement in the opposite direction.
And so now we can explain how those geodetic measurements balance almost perfectly.
When the mantle's surface gives way from the core's subtle outward displacement the mantle's viscosity limits its strain energy response to the weakest of all the mantle's surface areas. And once those few weak points have given way and formed a divergent boundary by tearing and melting, they will, by their structural weakness' and residual higher temperature and reduced viscosity, be reactivated repeatedly in the future as the variable mantle pulse thermal cycle repeats as describe in the various research shown. These few divergent boundaries with what are very modest infills (for example Pacific at 80-120mm and the N. Atlantic at 25mm) are balanced by the broad width of adjoining oceanic crusts that have been slightly raised in compression that is slowly bleeding away into the adjoining convergent boundaries.
"All of the observed tectonic plate domains that are semi-rigid and separating, are matched by other domains which are converging."
The inventory of Gravitational Potential Energy that was produced is then slowly released into the convergent boundaries because of the tremendous shear resistance it has to the mantle that is perfectly matched to the current rate of mantle displacement materializing at the divergent boundaries.
"Science is generated by and devoted to free inquiry: the idea that any hypothesis, no matter how strange, deserves to be considered on its merits. The suppression of uncomfortable ideas may be common in religion and politics, but it is not the path to knowledge; it has no place in the endeavor of science. We do not know in advance who will discover fundamental new insights."
Carl Sagan
-----------------------------------------------------------------------------------------------------------------
Page 7
A model for the
Strain energy forcing of the climate
-----------------------------------------------------------------------------------------------------------------------------------------------------------------------------------------------------------------
3.4 Referring back to the paper on mantle oscillations;
https://www.academia.edu/38174615/Mantle_thermal_pulses_below_the_Mid_Atlantic_Ridge_and_temporal_variations_in_the_formation_of_oceanic_lithosphere
Mantle thermal pulses below the Mid-Atlantic Ridge and temporal variations in the formation of oceanic lithosphere
Enrico Bonatti*†‡, Marco Ligi*, Daniele Brunelli*†, Anna Cipriani‡, Paola Fabretti*, Valentina Ferrante*†, Luca Gasperini* & Luisa Ottolini§
* Istituto di Scienze Marine, Geologia Marina, CNR, Via Gobetti 101, 40129, Bologna, Italy
† Dipartimento di Scienze della Terra, Universita` “La Sapienza”, Piazzale Aldo Moro 5, 00187, Rome, Italy
‡ Department of Earth and Environmental Sciences, Lamont Doherty Earth Observatory, Columbia University, Palisades, New York 10964, USA
§ Istituto di Geoscienze e Georisorse, Sezione di Pavia, CNR, Via Ferrata 1, 27100, Pavia, Italy
"A 20-Myr record of creation of oceanic lithosphere at a segment of the central Mid-Atlantic-Ridge is exposed along an uplifted
sliver of lithosphere. The degree of melting of the mantle that is upwelling below the ridge, estimated from the chemistry of
the exposed mantle rocks, as well as crustal thickness inferred from gravity measurements, show oscillations of ,3–4 Myr
superimposed on a longer-term steady increase with time. The time lag between oscillations of mantle melting and crustal
thickness indicates that the solid mantle is upwelling at an average rate of ,25mmyr, but this appears to vary through time."
"We calibrated our spinel and opx Cr# data in terms of degrees of melting assuming as a source a fertile, pyrolite-like peridotite13,15. Degrees of melting
calculated from Ti/Zr of cpx and from Cr# of opx and spinel correlate. They range along the VLS from 5.7% to 14.3%, with oscillations where the degree of melting appears to increase gradually and then decreases rapidly. These short-wavelength oscillations are superimposed on a long-term (.15Myr) trend of increasing degree of melting with time, estimated on a regression line to range from 7 ^ 1.5% about 19Myr ago, to 13 ^ 2% about 4Myr ago."
3.5 We have seen so far; how well the model explains the solar magnetic forcing of the Japanese earthquakes and how the simple periodic movement of the mantle that the model proposes is well documented in the study above. But that mechanical movement is only half the story, the title of the paper above is after all, called; "Mantle thermal pulses below the Mid-Atlantic Ridge". These surface movements are at their very basic a thermal phenomena. They are concurrent to the creation of magma at the crust/mantle boundary by the strain energy response of the displacing mantle. These thermal pulses and their accompanying magma would impose onto the overlaying ocean a thermal response of proportional degrees.
"show oscillations of ,3–4 Myr superimposed on a longer-term steady increase (and undoubtedly decrease) with time."
"The time lag between oscillations of mantle melting and crustal thickness indicates that the solid mantle is upwelling at an average rate of ,25mmyr, but this appears to vary through time."
"They range along the VLS from 5.7% to 14.3%, with oscillations where the degree of melting appears to increase gradually and then decreases rapidly. These short-wavelength oscillations are superimposed on a long-term (.15Myr) trend of increasing (and undoubtedly decreasing) degree of melting with time"
This is indicatIve of very specific levels of thermal energy at very fine resolution that were created and released at the mid-ocean ridges and under all oceanic plates in general. This thermal fingerprint can be observed in the climate record below.
http://www.giss.nasa.gov/research/briefs/hansen_15/

3.6 So, you're not quite convinced? Remember previously the Medieval Warm Period and the Little Ice Age were shown to have occurred in sync with solar magnetic 14C proxy and Japanese earthquake records. Let's take it up another notch.
http://pubs.usgs.gov.../fs-0095-00.pdf
"An early association between sunspots and terrestrial phenomena was the observation that the number and intensity of aurora borealis sightings were greatest during sunspot maxima when the sun was most active (active sun), and lowest during sunspot minima (quiet sun). Another terrestrial observation was that the Maunder Minimum coincided with the coldest part of the Little Ice Age."
This is that USGS graph from August 2000 again, showing carbon-14 content in tree rings going back in time 1,100 years. This is not a temperature proxy but a solar magnetic field energy level proxy, it is a count of the concentration, or lack thereof, of carbon-14 that has been measured in a chronological sampling of the individual seasonal rings of trees of similar growth characteristics. The tree ring content is at a specific value that is a measure of the atmospheric 14C.
Image below courtesy of USGS
http://pubs.usgs.gov/fs/fs-0095-00/fs-0095-00.pdf
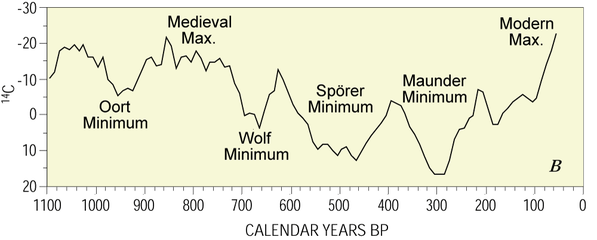
3.7 Referring to the previous NOAA article;
"Gerard C. Bond, a researcher at the Lamont Doherty Earth Observatory has suggested that the ~1,500 year cycle of ice-buildup in the North Atlantic is related to solar cycles; when the sun is at its most energetic, the Earth’s magnetic field is strengthened."
The same graph overlaid with the boundaries of the Medieval Warm Period and the Little Ice Age.

3.8 As you can see this is correlated very convincingly. On the right side of the graph the line moves up out of the little ice age, again this is not temperature shown here, it is 14C content in tree ring samples indicating magnetic field strength. (The 14C content is inverted) It is actually declining due to increasing solar magnetic flux, its content is inverted compared to the currently observed and debated temperature rise. An important point is this 14C variation is not due to any Earth bound forcing agent. The vertical rise (reduction in content) from about 1820 for example, is entirely the product of solar magnetic flux. The Sun's varying magnetic field is the only mechanism controlling 14C content and timing.
Now, for me to suggest there is a correlation between the solar magnetic field strength and the abnormal temperature increase of the last half century I will need to show evidence of extraordinarily unusual magnetic field strength that will correlate the 14C content in the graph with the atmospheric warming since The Little Ice Age.
http://www.ncdc.noaa...olanki2004.html
Unusual activity of the Sun during recent decades compared to the previous 11,000 years
Nature, Vol. 431, No. 7012, pp. 1084 - 1087, 28 October 2004.
S.K. Solanki1, I. G. Usoskin2, B. Kromer3, M. Schüssler1, and J. Beer4
1 Max-Planck-Institut für Sonnensystemforschung (formerly the Max-Planck- Institut für Aeronomie), 37191 Katlenburg-Lindau, Germany
2 Sodankylä Geophysical Observatory (Oulu unit), University of Oulu, 90014 Oulu, Finland
3 Heidelberger Akademie der Wissenschaften, Institut für Umweltphysik, Neuenheimer Feld 229, 69120 Heidelberg, Germany
4 Department of Surface Waters, EAWAG, 8600 Dübendorf, Switzerland

"According to our reconstruction, the level of solar activity during the past 70 years is exceptional, and the previous period of equally high activity occurred more than 8,000 years ago. We find that during the past 11,400 years the Sun spent only of the order of 10% of the time at a similarly high level of magnetic activity and almost all of the earlier high-activity periods were shorter than the present episode.
Now compare the graph above illustrating the current and exceptional solar magnetic field generator energy peak of the prior 10,000 years to the one below illustrating the current planetary magnetic field generator's exceptional energy level peak of the last 800,000 years. These two graphs illustrate quite accurately the mutual inductive coupling of the Sun's and the Earth's magnetic fields and their generators.

3.9 The solar magnetic and climate synchronicity is not just limited to the Medieval Warm Period or The Little Ice Age and the subsequent "extraordinary" warming period that followed up to the present. The solar magnetic energy levels that is recorded in tree ring 14C samples for the last 1100 years are bolstered by even greater data content from ice cores that shows an additional 11,400 years of solar magnetic and climate coupling.

3.9.1 Graph A
http://www.ncdc.noaa.gov/paleo/pubs/alley2000/alley2000.html
"This figure, adapted from the NRC (2002) report Abrupt Climate Change: Inevitable Surprises, comes from data in Alley (2000) and Cuffey and Clow (1997). It shows the clear, abrupt increases in temperature in the Greenland Ice Sheet Project 2 (GISP2) record at the end of the last glacial period and at the end of the Younger Dryas. The cooling as temperatures returned to the glacial conditions of the Younger Dryas takes place over a longer period in a step-wise fashion."
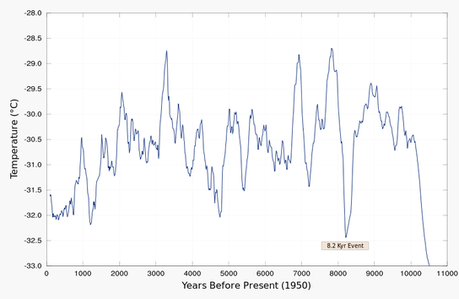
3.9.2 Graph B
The data from Alley (above and left) was used to make this graph B (on left) by Giorgiogp2, who has no connection to this author or this paper and was provided through Wikipedia Creative Commons.
It was compiled from Data source: http://www.ncdc.noaa.gov/paleo/pubs/alley2000/alley2000.html,
I took this graph and reversed it to have the most recent events on the right so it could then be more easily compared to the solar magnetic 14C content data in graph C, below left, that I had previously used to correlate the Japanese earthquake data and solar magnetic flux of the later part of the 20th century.

3.9.3 Graph C (Left)
http://www.ncdc.noaa.gov/paleo/pubs/solanki2004/solanki2004.html
Unusual activity of the Sun during recent decades compared to the previous 11,000 years - Nature, Vol. 431, No. 7012, pp. 1084 - 1087, 28 October 2004.
"According to our reconstruction, the level of solar activity during the past 70 years is exceptional, and the previous period of equally high activity occurred more than 8,000 years ago. We find that during the past 11,400 years the Sun spent only of the order of 10% of the time at a similarly high level of magnetic activity and almost all of the earlier high-activity periods were shorter than the present episode.
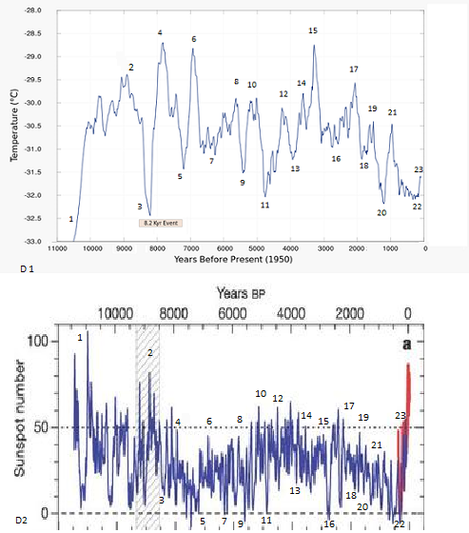
3.9.4 Graph D1 and D2 at left.
I then plotted the points of both the solar magnetic flux and temperature in synchronized chronological order between the two graphs, now referred as D1 and D2 at left.
What stands out first is the extremely high solar magnetic energy at 1 to the left on graph D2, the energy level is higher than even the unusually high solar magnetic level mentioned above and shown as the red vertical line extending above and to the right of Pt. 23.
Pt. 1 on the far left side of the graph occurred at the end of the Younger Dryas cold period that saw a rapid return to glacial conditions in the higher latitudes of the Northern Hemisphere between 12.9–11.5 ka BP. The high solar magnetic energy of Pt. 1 of D2 correlates to when the temperature climbed out of the Younger Dryas cold period at Pt. 1 of D1.
Graph D1 and D2 above.
3.9.5 Let’s look at graph A (left) again for additional clarity.
As you can see the extreme solar magnetic energy of point 1 occurred simultaneously with the temperature increase as the climate climbed out of the Younger Dryas, a remarkable correlation of two extreme events. It should also be noted this rise is as precipitous as the most recent solar magnetic energy level (Red) seen in graph C below.
Graph A above

Graph C
4.0 To have these two extreme warming events coincide with proportionate solar magnetic flux is beyond what could be considered coincidence; add to this the lesser but still concurrent events between these two extremes and this evidence should convince even the most reluctant observer that the current model is lacking in its abilities to accurately portray the observable world.
The rarity of this high magnetic energy is clear; "We find that during the past 11,400 years the Sun spent only of the order of 10% of the time at a similarly high level of magnetic activity and almost all of the earlier high-activity periods were shorter than the present episode."
The rarity of this high magnetic energy is clear; "We find that during the past 11,400 years the Sun spent only of the order of 10% of the time at a similarly high level of magnetic activity and almost all of the earlier high-activity periods were shorter than the present episode."
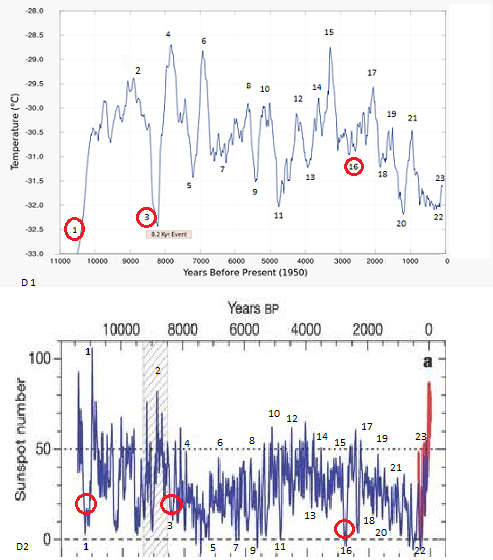
The 8.2 Kyr Event at Pt. 3 is very easily seen in graph D2, the energy level decrease from the graphs 4th highest peak of Pt.2 is clearly shown.
http://en.wikipedia.org/wiki/8.2_kiloyear_event
"The 8.2 kiloyear event was a sudden decrease in global temperatures . . . .and lasted for the next two to four centuries. Milder than the Younger Dryas cold spell that preceded it, but more severe than the Little Ice Age that would follow, the 8.2 kiloyear cooling was a significant exception to general trends of the Holocene climatic optimum. During the event, atmospheric methane concentration decreased by 80 ppb or 15% emission reduction by cooling and drying at a hemispheric scale."
What is important to understand is the spacing between the vertical lines such as is seen at Pt.1 and then again at Pt.3 and Pt.16 (red circles) shows a rather unusually large gap indicating an extended period of low magnetic energy. This would allow the dissipation of planetary thermal content and a substantial drop in average temperatures as the cooling ocean allows the atmospheric content to move down also.
Other pronounce points such as 4-5 and 10-11 allowed enough cooling (gaps between lines) to show as such on graph D1.
This models ability to explain this correlation gives credence to its accuracy. The surface temperature variation is simply a byproduct of the Earth’s field generator’s responses to the variations in the Sun’s magnetic field generator.
4.1 These cycles take millions of years, slowly moving in a inclined saw tooth pattern going upward as the interior warms and then downward as it slowly cools, the sawtooth variation showing the smaller scale two directional temperature variations of the Mantle thermal pulses (as seen above). The smallest of these two directional movements becomes discernible at the amazingly narrow solar magnetic variations seen below corresponding to the well documented climate variations that occurred across the last millennia.
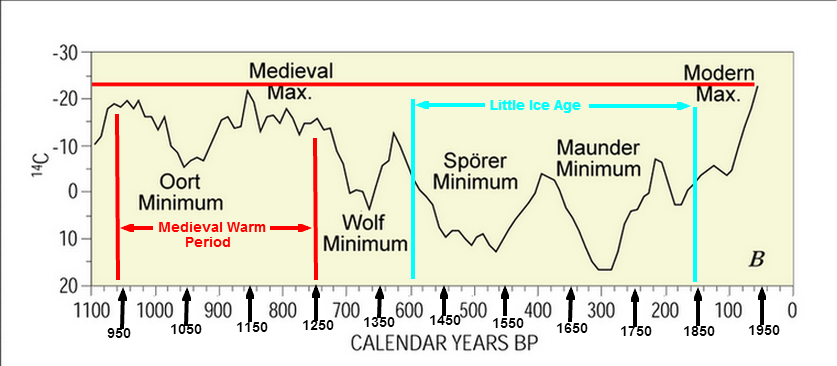
-----------------------------------------------------------------------------------------------------------------
Page 8
A model for
Mantle driven climate variability
-----------------------------------------------------------------------------------------------------------------------------------------------------------------------------------------------------------------
One would naturally question how the mantle thermal pulses could produce such fine resolution in climate variation. Climate variability over millions of years seems reasonable. Maybe even at hundred thousand year periodicities, but variation over less than a century, let alone a few centuries, seems impossible despite what has been shown by the preceding 14C and Beryllium-10 (10Be) correlations shown above.
But this is because we are rather biased to our crustal surface environs and what we assume is a steady and rather passive thermal content that arrives from below. We don't imagine that the mighty ocean that dominates 70 percent of our planet's surface could be thermally moved from below in mere decades as this paper has described and is shown in the graph above.
Is the ocean really as thermally imposing as we have imagined it to be? The massive Sun's abundant energy is warming the ocean's surface and it in turn by its own thermal content is moderating the atmosphere above it. This steady and rather consistent process seems unable to explain the thermal history seen in the graphs that this paper has describe and outlined.
4.2 But let us consider a reexamination of these thermal content sources.
mantle - National Geographic Society nationalgeographic.org/encyclopedia/mantle/
"The mantle is about 2,900 kilometers (1,802 miles) thick, and makes up a whopping 84% of Earth's total volume"
- Crust (geology) - Wikipedia
While in contrast the oceanic crust is - "5 km (3 mi) to 10 km (6 mi) thick and is composed primarily of basalt, diabase, and gabbro. The continental crust is typically from 30 km (20 mi) to 50 km (30 mi)"
http://solarviews.com/eng/earthint.htm
"Oceanic crust: 0.099% of Earth's mass; depth of 0-10 kilometers (0 - 6 miles)
“The oceanic crust contains 0.147% of the mantle-crust mass. The oceanic ridge system, a 40,000-kilometer (25,000 mile) network of volcanoes, generates new oceanic crust at the rate of 17 km3 per year.”
But the mass differential between the mantle and the ocean is the most reveling difference between the two that in turn explains how the Earth's short term climate history can be driven by, and timed with, the Sun's solar magnetic history.
With the mantle's mass at 67% of the Earth's total; The ocean is a mere 0.022 percent of the total mass of Earth while the atmosphere weighs a little over a millionth (0.000 001) or 1/1,200,000 of one Earth mass.
4.3 So, as displayed and described by this model, by way of the sheer mass differential between them, the mantle could with very little effort from very infinitesimal mantle displacements produce a continual and varying short term thermal content into the ocean by way of the oceanic crust. We imagine the ocean as being imposingly deep and consistently cold at its deepest regions, but again this is the product of our own bias's of our own making.
Consider the following;
http://www.scribd.com/doc/61249428/Introduction-to-Physical-Oceanography#outer_page_32
"Oceanic dimensions range from around 1500 km (932 miles) for the minimum width of the Atlantic to more than 13,000 km (8,077) for the north-south extent of the Atlantic and the width of the Pacific. Typical depths are only 3–4 km. So horizontal dimensions of ocean basins are 1,000 times greater than the vertical dimension. A scale model of the Pacific, the size of an 8.5 x ×11 inch sheet of paper, would have dimensions similar to the paper: a width of 10,000 km scales to 10 in, and a depth of 3 km scales to 0.003 in, the typical thickness of a piece of paper."
https://www2.usgs.gov/blogs/features/usgs_top_story/how-much-water-is-available/?from=image
"The graphic (below) shows various blue spheres representing relative amounts of Earth's water in comparison to the size of the Earth. Are you surprised that these water spheres look so small? They are only small in relation to the size of the Earth. These images attempt to show three dimensions, so each sphere represents "volume." Overall, it shows that in comparison to the volume of the globe the amount of water on the planet is very small - and the oceans are only a "thin film" of water on the surface."
"The graphic (below) shows various blue spheres representing relative amounts of Earth's water in comparison to the size of the Earth. Are you surprised that these water spheres look so small? They are only small in relation to the size of the Earth. These images attempt to show three dimensions, so each sphere represents "volume." Overall, it shows that in comparison to the volume of the globe the amount of water on the planet is very small - and the oceans are only a "thin film" of water on the surface."
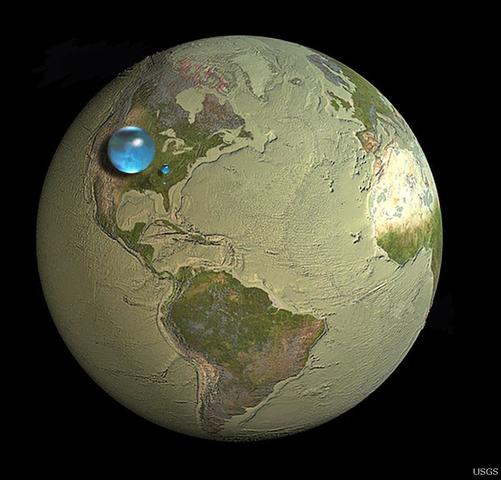
"If you took all the water on earth – in oceans, ice caps, lakes, rivers, groundwater, the atmosphere, and living things – and wrapped it into a sphere, it would have a diameter of about 860 miles. That 860-mile-high sphere is represented by the largest bubble in the picture, which stretches from Salt Lake City, Utah to Topeka, Kan. It has a volume of over 332 million cubic miles. If you popped this bubble with a giant pin, the resulting flow would cover the lower 48 states to a depth of about 107 miles."
"In reality, most of the largest bubble is stretched over about 70 percent of Earth’s surface, a very thin layer over the land. As we stare out into them, we think of oceans as vast expanses. And in many parts of the world we feel water-rich, even as we hear stories of regions where water is far from abundant. This graphic shows that this amount of water is not nearly as abundant as it may feel."
"In reality, most of the largest bubble is stretched over about 70 percent of Earth’s surface, a very thin layer over the land. As we stare out into them, we think of oceans as vast expanses. And in many parts of the world we feel water-rich, even as we hear stories of regions where water is far from abundant. This graphic shows that this amount of water is not nearly as abundant as it may feel."
When you consider that just below that "thin film of water on the surface" there is just 5 km (3 mi) to 10 km (6 mi) of similarly thin oceanic crust directly exposed to the mantle that makes up 84% of Earth's total volume with temperatures between 500 to 900 °C (932 to 1,652 °F) at the upper boundary with the crust.
The ocean no longer seems so imposing and intransigent to the possible thermal influences from the mantle does it?
ftp://ftp.nodc.noaa.gov/pub/data.nodc/woa/PUBLICATIONS/grlheat05.pdf Warming of the world ocean, 1955–2003
S. Levitus, J. Antonov, and T. Boyer
National Oceanographic Data Center, NOAA, Silver Spring, Maryland, USA
Received 22 September 2004; revised 24 November 2004; accepted 8 December 2004; published 22 January 2005.
"Thus, a mean temperature change of 0.1 C. of the world ocean would correspond roughly to a mean temperature change of 100 C. of the global atmosphere if all the heat associated with this ocean anomaly was instantaneously transferred from the ocean to the atmosphere. This of course will not happen but this computation illustrates the enormous heat capacity of the ocean versus the atmosphere."
4.4 Can you imagine now, using the appropriate examples of thermal capacities between the mantle, crust and ocean, what energies the massive mantle can through mere subtle thermal pulses dispose onto the thin oceanic crust, that shallow ocean and then onto the atmosphere itself?
What evidence is there that these transient thermal pulses have at times been beyond anything that our current understanding can account for;
http://www.clim-past.net/7/831/2011/cp-7-831-2011.pdf
Down the Rabbit Hole: toward appropriate discussion of methane release from gas hydrate systems during the Paleocene-Eocene thermal maximum and other past hyper-thermal events G. R. Dickens1,2
1Department of Geological Sciences, Stockholm University, Stockholm, Sweden
2Department of Earth Sciences, Rice University, Houston, USA
Received: 21 March 2011 – Published in Clim. Past Discuss.: 6 April 2011
Revised: 30 June 2011 – Accepted: 1 July 2011 – Published: 5 August 2011
This is a great article on a geologic mystery, the Early Eocene climatic optimum (EECO) ca. 52–50 million years ago. Where temperatures in at least high-latitudes and in the deep ocean, warmed by at least 5 C. from the late Paleocene ca. 57.5 million years ago, an additional 5–8 C. warming of the atmosphere and ocean occurred between 55.5 and 56.3 million years ago. This event is called the Paleocene-Eocene Thermal Maximum (PETM) and it lasted less than 200,000 years.
Enormous amounts of 13C-depleted carbon rapidly entered the carbon cycle during the beginning of the Paleocene-Eocene Thermal Maximum. Explanation for this carbon input has been thermal warming causing the release of the gas hydrate on oceanic continental slopes, followed by release of methane CH4 from the seafloor and its subsequent oxidation to CO2 in the ocean or atmosphere.
The revelation that atmospheric carbon increase resulted from the deep ocean warming is difficult to explain using the standard model. The strain energy at the crust/mantle boundary of this model would undoubtedly supply such a response. The thermal content would need to migrate into the seafloor mud and liberate the gas hydrate, the dissolved C02 was then carried to the surface and released where it produce the increased atmospheric CO2 content. The article continued with more incredible figures of geologic discharges.
"At least five other events, presently called ETM2/H1, H2, I1, I2, and K/X (following Cramer et al., 2003), have been identified in multiple records and follow the PETM at approximately 53.7, 53.6, 53.3, 53.2, and 52.5 Ma. Like the PETM, these events display evidence for Earth surface warming (including in the deep-sea) and massive injection of 13C-depleted carbon to the ocean and atmosphere; more interestingly, with available data, they appear coupled to orbital forcing and to have a relationship between magnitude and time."
"The volume and timing of the release of carbon requires a massive discharge into the ocean with the mass depending on the 13C composition of the source. "About 6000–12000 Gigatonnes of Carbon with a 13C of −25‰. In comparison, burning and use of almost all fossil fuel reserves will emit about 4000–5000 Gigatonnes of Carbon by 2500 AD with a 13C value of about −30 ‰. Geologists have no mechanism within the framework of conventional carbon cycle models to explain a geologically rapid and truly global >2.5‰ negative 13C excursion, except by human extraction and burning of most known fossil fuel resources. This problem regarding the PETM forces the Earth Science community to “think outside the box” (G. R. Dickens 2011)."
4.5 To say this is not an easy thermal phenomenon to model from a solar thermal radiation direction is an understatement. To “think outside the box” is to think in the opposite direction at a thermal variability in the magnetic field generator. I'm not implying that solar thermal radiation is not the primary energy source at play in the ocean-atmosphere complex. I think everyone agrees the Sun's solar thermal radiation is the dominant player in this thermal system, the question is can we have unanswered thermal anomalies as seen above and assign it a solution that cannot be considered for any of the other anomalies such as the PETM. Whereas, a variable thermal cycle from the core that displaces the mantle, producing strain energy thermal content at the crust/mantle boundary can be shown possible to produced any and all of these thermal phenomena.
This model would predict that these massively larger deep ocean excursions described above are just part of a consistent and regular record of climate forcing through a deep ocean warming by mantle thermal pulses. These should be detectable down to very remarkably narrow periods of even a century or less.
https://www.nature.com/articles/s41586-018-0614-0
Letter | Published: 24 October 2018
CO2 storage and release in the deep Southern Ocean on millennial to centennial timescales
J. W. B. Rae, A. Burke, L. F. Robinson, J. F. Adkins, T. Chen, C. Cole, R. Greenop, T. Li, E. F. M. Littley, D. C. Nita, J. A. Stewart & B. J. Taylor
Nature volume 562, pages 569–573 (2018)
Abstract
"The cause of changes in atmospheric carbon dioxide (CO2) during the recent ice ages is yet to be fully explained. Most mechanisms for glacial–interglacial CO2 change have centred on carbon exchange with the deep ocean, owing to its large size and relatively rapid exchange with the atmosphere1. The Southern Ocean is thought to have a key role in this exchange, as much of the deep ocean is ventilated to the atmosphere in this region2. However, it is difficult to reconstruct changes in deep Southern Ocean carbon storage, so few direct tests of this hypothesis have been carried out. Here we present deep-sea coral boron isotope data that track the pH—and thus the CO2 chemistry—of the deep Southern Ocean over the past forty thousand years. At sites closest to the Antarctic continental margin, and most influenced by the deep southern waters that form the ocean’s lower overturning cell, we find a close relationship between ocean pH and atmospheric CO2: during intervals of low CO2, ocean pH is low, reflecting enhanced ocean carbon storage; and during intervals of rising CO2, ocean pH rises, reflecting loss of carbon from the ocean to the atmosphere. Correspondingly, at shallower sites we find rapid (millennial- to centennial-scale) decreases in pH during abrupt increases in CO2, reflecting the rapid transfer of carbon from the deep ocean to the upper ocean and atmosphere. Our findings confirm the importance of the deep Southern Ocean in ice-age CO2 change, and show that deep-ocean CO2 release can occur as a dynamic feedback to rapid climate change on centennial timescales."
It would be this model's contention that "rapid (millennial- to centennial-scale) decreases in pH during abrupt increases in CO2, reflecting the rapid transfer of carbon from the deep ocean to the upper ocean and atmosphere" is indicative of a very sudden and sizable thermal source immediately adjacent, or more probable, just below, the carbon source. It's difficult to imagine something as passively mundane as solar thermal energy producing such a dramatic and rapid response from such a remote location. "abrupt" describes a mantle thermal pulse.
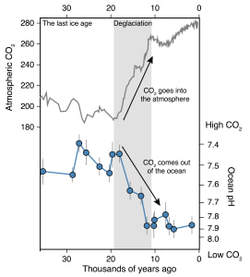
https://andthentheresphysics.wordpress.com/2018/11/18/co2-sequestration-during-glacial-maxima/
"What Rae et al. (2018) did is to look at deep-sea coral boron isotope data that track the pH — and thus the CO2 chemistry — of the deep Southern Ocean over the past forty thousand years. What they found is shown in the figure on the right. What it indicates is that as we moved from the Last Glacial Maximum (LGM) into the current inter-glacial, the pH of the deep Southern Ocean increased. This is consistent with the deep Southern Ocean sequestering CO2 during the LGM and then releasing it as we moved into the inter-glacial. As I mentioned at the beginning of this post, this is also the opposite of what we’d have expected if this region had been exchanging CO2 with the atmosphere during the LGM."
"So, this new work may have resolved one of the puzzles associated with the glacial cycles and demonstrates that a large amount of CO2 was indeed probably sequestered in the deep Southern Ocean during the glacial periods."
Ocean Warming: From the Surface to the Deep in Observations and Models
Durack, Gleckler, et al.
Oceanography; 9 Dec 2018;
Although considerable work has conclusively shown significant warming in the upper (<700 m) ocean where the bulk of historical ocean temperature measurements are found (e.g., Rhein et al., 2013, and the section above on The Observing Network), and extending down to 2,000 m during the recent Argo period, there is now a growing consensus supported by numerous studies that changes are also occurring in the deeper global ocean (>2,000 m). Based on observations below 2,000 m, it is estimated that the global ocean has accumulated heat at a rate of 33 ± 21 TW over 1991 to 2010 (Desbruyeres et al., 2016). Two-thirds of this warming is occurring between 2,000 m and 4,000 m, albeit with large uncertainty, almost entirely owing to warming in the Southern Ocean in this depth range (see Sallée, 2018, in this issue). Below 4,000 m, the observations show a large meridional gradient in the deep warming rate, with the southernmost basins warming 10 times faster than the deep basins to the north (Figure 5A). While the warming below 4,000 m only accounts for one-third of the total warming below 2,000 m, the regional variability is lower, leading to greater statistical certainty in the abyssal changes (4,000 m to 6,000 m; Purkey and Johnson, 2010; Desbruyeres et al., 2016; Figure 5A).
Deep and abyssal ocean warming from 35 years of repeat hydrography.
Desbruyeres, Purkey, et al.
Geophysical Research Letters;
The strongest warming rates are found in the abyssal layer (4000–6000 m), which contributes to one third of the total heat uptake with the largest contribution from the Southern and Pacific Oceans.
So, this new model proposes there should be correlating evidence that this deep and abyssal warming is associated to tectonic movement. Where the clear predictions made over a decade ago by this model can be observed in the contemporary research;
https://www.nature.com/articles/s41561-022-01025-x
Article
Published: 15 September 2022
Climatic and tectonic drivers of late Oligocene Antarctic ice volume
B. Duncan, R. McKay, R. Levy, T. Naish, J. G. Prebble, F. Sangiorgi, S. Krishnan, F. Hoem, C. Clowes, T. Dunkley Jones, E. Gasson, C. Kraus, D. K. Kulhanek, S. R. Meyers, H. Moossen, C. Warren, V. Willmott, G. T. Ventura & J. Bendle
Nature Geoscience (2022)Cite
Abstract
“Cenozoic evolution of the Antarctic ice sheets is thought to be driven primarily by long-term changes in radiative forcing, but the tectonic evolution of Antarctica may also have played a substantive role. While deep-sea foraminiferal oxygen isotope records provide a combined measure of global continental ice volume and ocean temperature, they do not provide direct insights into non-radiative influences on Antarctic Ice Sheet dynamics. Here we present an Antarctic compilation of Cenozoic upper-ocean temperature for the Ross Sea and offshore Wilkes Land, generated by membrane lipid distributions from archaea. We find trends of ocean temperature, atmospheric carbon dioxide and oxygen isotopes largely co-vary. However, this relationship is less clear for the late Oligocene, when high-latitude cooling occurred despite interpretation of oxygen isotopes suggesting global warming and ice-volume loss. We propose this retreat of the West Antarctic Ice Sheet occurred in response to a tectonically driven marine transgression, with warm surface waters precluding marine-based ice-sheet growth. Marine ice-sheet expansion occurred only when ocean temperatures further cooled during the Oligocene–Miocene transition, with cold orbital conditions and low atmospheric carbon dioxide. Our results support a threshold response to atmospheric carbon dioxide, below which Antarctica’s marine ice sheets grow, and above which ocean warming exacerbates their retreat.”
The mantle thermal pulses should now seem easily capable of very infinitesimal mantle displacements that could produce a continual and varying short term thermal content into the ocean by way of the oceanic crust. These of course fit very nicely to documented thermal anomalies seen to occur as glaciated periods transitioned into inter-glacial periods.
https://en.wikipedia.org/wiki/Younger_Dryas
"The change to glacial conditions at the onset of the younger Dryas in the higher latitudes of the Northern Hemisphere between 12,900–11,500 BP in calendar years has been argued to have been quite abrupt. in sharp contrast to the warming of the preceding Older Dryas interstadial. It has been inferred that its end occurred over a period of a decade or so, but the onset may have been faster." . . . . . .
. . . . . ."Various paleoclimatic records from ice cores, deep sea sediments, speleothems, continental paleobotanical data, and loesses show similar abrupt climate events, which are consistent with Younger Dryas events, during the terminations of the last four glacial periods. They argue that Younger Dryas events might be an intrinsic feature of deglaciations that occur at the end of glacial periods." . . . . . .
. . . . . . . "Measurements of oxygen isotopes from the GISP2 ice core suggest the ending of the Younger Dryas took place over just 40–50 years in three discrete steps, each lasting five years. Other proxy data, such as dust concentration, and snow accumulation, suggest an even more rapid transition, requiring about a 7 °C (13 °F) warming in just a few years.Total warming in Greenland was 10 ± 4 °C (18 ± 7 °F)."
4.6 This study from 2014 shows a convincing correlation between tree ring climate data and the solar magnetic record.
http://www.ncbi.nlm.nih.gov/pmc/articles/PMC3972095/
PLoS One. 2014; 9(4): e93504.
Published online 2014 Apr 1. doi: 10.1371/journal.pone.0093504
PMCID: PMC3972095
Tree-Ring Based May-July Temperature Reconstruction Since AD 1630 on the Western Loess Plateau, China
Huiming Song, Yu Liu, Qiang Li,1 Na Gao, Yongyong Ma, and Yanhua Zhang
Eryuan Liang, Editor
Abstract
Tree-ring samples from Chinese Pine (Pinus tabulaeformis Carr.) collected at Mt. Shimen on the western Loess Plateau, China, were used to reconstruct the mean May–July temperature during AD 1630–2011. The regression model explained 48% of the adjusted variance in the instrumentally observed mean May–July temperature. The reconstruction revealed significant temperature variations at interannual to decadal scales. Cool periods observed in the reconstruction coincided with reduced solar activities. The reconstructed temperature matched well with two other tree-ring based temperature reconstructions conducted on the northern slope of the Qinling Mountains (on the southern margin of the Loess Plateau of China) for both annual and decadal scales. In addition, this study agreed well with several series derived from different proxies. This reconstruction improves upon the sparse network of high-resolution paleoclimatic records for the western Loess Plateau, China.
Method
To identify climate-growth relationships for the Chinese pine on Mt. Shimen (MSM), a correlation analysis was performed for monthly mean temperature, monthly total precipitation and PDSI over the previous and current years of tree growth. The model stability and reliability were assessed using a split-sample method in which the model was divided into two subsets of equal length [20], [21].The Pearson correlation coefficient (r), the positive RE (reduction of error) and CE (coefficient of efficiency) are the items to evaluate the results. Spatial correlations were used to assess the representativeness of our reconstruction by using the KNMI Climate Explorer (Royal Netherlands Meteorological Institute; http://climexp.knmi.nl).
The positive RE and CE results indicated that the reconstruction contributes unique paleoclimatic information. In addition, Figure 5a showed that the reconstruction closely tracked the observed temperature.
Temperatures on Mt. Shimen
Figure 5b shows the reconstructed May-July temperature variations since AD 1630 and its 20-year low-pass filter on Mt. Shimen (MSM) This series shows interannual to multi-decadal variability (Fig. 5b). The long cooling period from AD 1640 to 1720 corresponds with well-known periods of solar minima (Maunder Minimum) during AD 1645–1715 [19]. Two obvious cool periods that occurred during the 1880s–1900s and the 1930s–1960s coincide with the 1900 minimum (AD 1880–1900) and a slight decrease in sun activity from AD 1940–1970, respectively [27]. The cool period during the reconstruction matched all solar minima except the Dalton minimum (AD 1800–1820), implying that solar forcing likely played an important role in past climate change for MSM. The longest warming trend occurred during AD 1720s–1810s and was followed by a mild climate for approximately 50 years. In addition, the filtered reconstruction indicates that the warming since AD 1970s is not significant and does not exceed the natural temperature variations that occurred over the past 400 years. AD 1928 stands out as an unusually warm year and corresponds with the drought event in AD 1928–1929, which has been noted as a dominant feature of the drought record throughout northern China[28], [29]. Additionally, the warm year of AD 2000 is consistent with the severe drought that occurred in China [9].
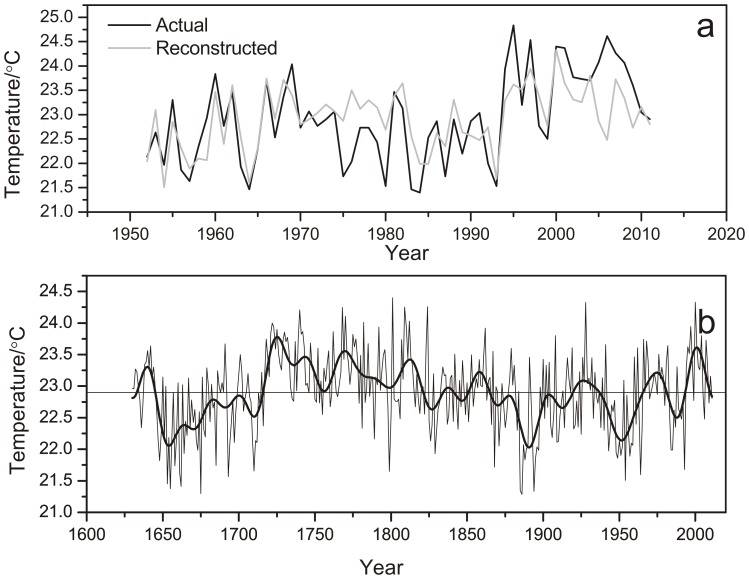
-----------------------------------------------------------------------------------------------------------------
Page 9
Evidence of a
correlated and cyclical
behavior of
Crustal movement and climate
-----------------------------------------------------------------------------------------------------------------------------------------------------------------------------------------------------------------
4.6.5 Previously, this model showed us a remarkable prediction of the correlation of solar magnetic 14C proxy data, climate data (Medieval Warm Period and Little Ice Age) and Japanese earthquake records beginning in the Edo period and continuing up to the present time. Thus showing the model's predictive abilities to provide a simple chain of causative relay as the Earth's field generator responded to an increase in solar magnetic forcing and then relayed its thermal response into the surrounding mantle and initiating the corresponding seismic energies and accompanying transient climate.
Some might wonder if that correlation could be just a coincidence and unlikely to be found to have happened previously at a different time in the geologic record.
4.7 This model proposes that the energy responsible for subduction is gravitational potential energy (GPE) within the crust, which is put into motion as kinetic energy when the mantle periodically subsides. This variable GPE will slowly increase as the crust incrementally becomes compressed by the subsiding mantle as it responds to the thermal contraction of the core. This GPE is present, to some degree, at all times in the crust but is at its highest potential when the mantle's subsidence outpaces the trenches' ability to process the subducting crust at a rate high enough to keep pace with the mantle's movement towards the core. As these two metrics diverge the GPE in the crust will increase. When the core's thermal cycle changes to outward displacement the GPE is then slowly reduced as the outward movement of the mantle increasingly re-supports the crust.
This cycle however is punctuated by distinct periods when oceanic crust is produced. These periods only occur during the outward displacement portion of the cycle as the divergent oceanic plate sections are moved apart by the displacing mantle. These active spreading periods will be shown to correlate to climate warm periods, and alternately, it will be shown that the climate cools when the active seafloor spreading periods slow or in rare instances; come to an end.
In the study below the research strongly indicates that this link is evident in the geologic record. The seafloor spreading appears to have almost completely halted or slowed to barely discernible levels for 250 million years. At which time the Earth entered a period known as Snowball Earth.
https://www.researchgate.net/publication/223745786_Evidence_and_implications_for_a_widespread_magmatic_shutdown_for_250_My_on_Earth
Evidence and implications for a widespread magmatic shutdown for 250 My on Earth
Earth & Planetary Sci. Letters 282, (2009): 294-298 Condie, K. C., O’Neill, C. and Aster, R.
Abstract
"Analysis of the global distribution of U/Pb ages of both subduction-related granitoids and of detrital zircons suggests that a widespread reduction in magmatic activity on Earth beginning about 2.45 Ga and lasting for 200–250 My. . . . . . .There is little Nd or Hf isotopic evidence to support significant additions to the continental crust at convergent plate margins between 2.45 and 2.2 Ga. . . . . . . Oxygenation of the atmosphere at 2.4 Ga followed by widespread glaciation at 2.4–2.3 Ga also may be related to the initiation of the global magmatic lull. We suggest that an episodic mantle thermal regime, during which a large part of the plate circuit effectively stagnates, may explain the 250-My magmatic age gap on Earth and a remarkable feature of the Paleoproterozoic record."
Conclusions
"The distribution of U/Pb zircon ages from both subduction-related granitoids and detrital sediments shows a pronounced and robust minimum between 2.45 and 2.2Ga .Furthermore, there is a sparsity of greenstones and subduction-related granitoids, as well as evidence for juvenile continental crust in this 250-My time window. We hypothesize that this reflects a globally significant period of cessation or slowdown global magmatism and perhaps in plate tectonics".
http://www.nmt.edu/news/3243-tech-professors-research-making-international-headlines
Tech Professor's Research Making International Headlines
"SOCORRO, N.M. – New Mexico Tech geophysics professor Dr. Kent Condie has been making headlines around the world in recent weeks."
"Condie is the first author of an academic paper in Earth and Planetary Science Letters that purports to show evidence that tectonic activity slowed to a crawl for more than 200 million years, creating a scenario some scientists call “snowball Earth.” Condie’s paper has two co-authors: Dr. Craig O’Neill of Macquarie University in Sydney, Australia and Dr. Rick Aster, also of New Mexico Tech. The trio analyzed data from many sources in geology, geochemistry and geochronology."
This very significant and "widespread magmatic shutdown" event described by Condie et.al. above would appear at a very specific transitional period of the already observed mantle thermal pulses of Bonatti et. al. Specifically, that when the Sun's solar magnetic energy generation output ended abruptly, the final outward period of the current mantle thermal pulse would have ended also. The Sun then entered a +/- 250 million year solar magnetic energy level hiatus. As the Earth's crust slowly distributed the last of its gravitational potential energy and its resultant latent plate movement, the planet continued to cool to the point that was described by Condie et.al. as a "widespread magmatic shutdown". This period was called the Huronian glaciation and is considered one of the most extensive glaciated periods often referred to as a Snow Ball Earth.
So here we have two of the three predicted correlated phenomena. In this case, the stagnant plate movement and climate that both exhibit the historical, all time lowest observed energy state of both climate and tectonic plate energies. What about the Solar/planetary magnetic field component? The model would predict that the Solar magnetic field energies would be very low, and the corresponding Planetary field would be so low for so long that there would be no significant variable mantle displacement and it's accompanying strain energy thermal warming of the oceans and atmosphere.
In this study below the researchers have sampled the lowest recorded planetary magnetic field strength less then 100 Ma after another major global glaciation that took place during the Ediacaran. "The Marinoan glaciation, was a period of worldwide glaciation. Its beginning occurred no earlier than 654.5 Ma (million years ago). It ended approximately 632.3 ± 5.9 Ma during the Cryogenian period. This glaciation possibly covered the entire planet, in an event also referred to as a Snowball Earth." -https://en.wikipedia.org/wiki/Marinoan_glaciation
And was just after the; "Gaskiers glaciation a period of widespread glacial deposits that lasted under 340 thousand years, between 579.63 ± 0.15 and 579.88 ± 0.44 million years ago i.e. late in the Ediacaran Period — making it the last major glacial event of the Precambrian. It was also the last and the shortest of at least three major ice ages in the Neoproterozoic era. It is assumed that, in contrast to the Sturtian and Marinoan periods, it did not lead to global glaciation." -https://en.wikipedia.org/wiki/Gaskiers_glaciation
https://www.nature.com/articles/s41561-018-0288-0
Article Published: 28 January 2019
Young inner core inferred from Ediacaran ultra-low geomagnetic field intensity
Richard K. Bono, John A. Tarduno, Francis Nimmo & Rory D. Cottrell
Nature Geoscience volume 12, 143–147 (2019)
" Here we present palaeointensity data from the Ediacaran (~565 million years old) Sept-Îles intrusive suite measured on single plagioclase and clinopyroxene crystals that hosted single-domain magnetic inclusions. These data indicate a time-averaged dipole moment of ~0.7 × 10²² A m2, the lowest value yet reported for the geodynamo from extant rocks and more than ten times smaller than the strength of the present-day field."
The model suggests that a correlation will be made between solar/planetary magnetic field strength, tectonic plate movement and climate. The first being the solar magnetic energy increase at the end of the Little Ice Age that aligns to the greater quantity and severity of Japanese earthquakes. Marking a distinct period of a transition of the phenomena from a lower to a higher energy state. And now the same model appears it can plausibly predict and show the phenomena in an energy correlation of the lowest detected planetary magnetic field energy or the lowest detected tectonic plate kinetic energy occurring when the planet endured two of the largest and coldest known climate periods in Earth's history.
We can imagine that moment +/- 250 million years later when the solar magnetic energy output spiked back to the required levels to restart those higher energy Bonatti mantle thermal pulses once again, producing strain energy displacement of the mantle and releasing thermal content at the crust mantle boundary and the newly activated divergent boundaries.
So now we can see that the solar magnetic generator's variable cycle of operational quantity and duration would fit nicely to this phenomenon as well as it does to those more mundane cycles discussed earlier that were attributed to the general plate movement idea of this model.
What does plate movement look like at the transition periods where plate energies wind-down to 0 and the solar magnetic energy comes back up suddenly to levels that produce basaltic magma province size eruptions like those that began forming the Atlantic ocean basin?
https://www.science.org/doi/10.1126/sciadv.abo0866
Reduced plate motion controlled timing of Early Jurassic Karoo-Ferrar large igneous province volcanism
Micha Ruhl, Stephen P. Hesselbo, Hugh C. Jenkyns, Weimu Xu., Ricardo L. Silva, Kara J. Matthews, Tamsin A. Mather, Conall Mac Niocaill, And James B. Riding
SCIENCE ADVANCES
9 Sep 2022 Vol 8, Issue 36
DOI: 10.1126/sciadv.abo0866
Abstract
"Past large igneous province (LIP) emplacement is commonly associated with mantle plume upwelling and led to major carbon emissions. One of Earth’s largest past environmental perturbations, the Toarcian oceanic anoxic event (T-OAE; ~183 Ma), has been linked to Karoo-Ferrar LIP emplacement. However, the role of mantle plumes in controlling the onset and timing of LIP magmatism is poorly understood. Using global plate reconstruction models and Lower Toarcian sedimentary mercury (Hg) concentrations, we demonstrate (i) that the T-OAE occurred coevally with Karoo-Ferrar emplacement and (ii) that timing and duration of LIP emplacement was governed by reduced Pangean plate motion, associated with a reversal in plate movement direction. This new model mechanistically links Earth’s interior and surficial processes, and the mechanism is consistent with the timing of several of the largest LIP volcanic events throughout Earth history and, thus, the timing of many of Earth’s past global climate change and mass extinction events."
"The Siberian Traps, the Karoo-Ferrar, the North Atlantic Igneous Province, and the East African Rift LIP regions all show a substantial reduction in local plate velocities and an associated reduction in local total plate movement in the millions of years leading up to LIP emplacement"
So, we can see in the paper above the plate movement of this model describes and predicts perfectly the conditions described in the just published research where GPE is dispersing to the point of cessation of plate movement in one specific direction several million years before the initiation of a large igneous province and the resultant plate movement in the opposite direction.
Where have we also seen this direction reversing plate behavior described in the available research?
https://www.researchgate.net/publication/309737839_Rapid_conversion_of_an_oceanic_spreading_center_to_a_subduction_zone_inferred_from_high-precision_geochronology
Rapid conversion of an oceanic spreading center to a subduction zone inferred from high-precision geochronology
Timothy E. Keenan (a), John Encarnación (a1), Robert Buchwaldt (b), Dan Fernandez (c), James Mattinson(d), Christine Rasoazanamparany (e), and P. Benjamin Luetkemeyer(a)
Author Affiliations
aDepartment of Earth and Atmospheric Sciences, Saint Louis University, St. Louis, MO 63108;
bDepartment of Earth and Environment, Boston University, Boston, MA 02215;
cSchlumberger-WesternGeco, Geosolutions-Interpretation, Houston, TX 77042;
dDepartment of Earth Science, University of California, Santa Barbara, CA 93106
eDepartment of Geology and Environmental Earth Science, Miami University, Oxford, OH 45056
Edited by W. G. Ernst, Stanford University, Stanford, CA, and approved October 11, 2016 (received for review June 20, 2016)
Significance
"Subduction, the process by which tectonic plates sink into the mantle, is a fundamental tectonic process on Earth, yet the question of where and how new subduction zones form remains a matter of debate. In this study, we find that a divergent plate boundary, where two plates move apart, was forcefully and rapidly turned into a convergent boundary where one plate eventually began subducting. This finding is surprising because, although the plate material at a divergent boundary is weak, it is also buoyant and resists subduction. This study suggests that buoyant, but weak, plate material at a divergent boundary can be forced to converge until eventually older and denser plate material enters the nascent subduction zone, which then becomes self-sustaining."
Abstract
"Where and how subduction zones initiate is a fundamental tectonic problem, yet there are few well-constrained geologic tests that address the tectonic settings and dynamics of the process". . . . . . . . . . . "In the western Philippines, we find that oceanic crust was less than ∼1 My old when it was underthrust and metamorphosed at the onset of subduction in Palawan, Philippines, implying forced subduction initiation at a spreading center. This result shows that young and positively buoyant, but weak, lithosphere was the preferred site for subduction nucleation despite the proximity of other potential weak zones with older, denser lithosphere and that plate motion rapidly changed from divergence to convergence".
The divergent boundary "was forcefully and rapidly turned into a convergent boundary".
These observations have consistently shown that the tectonic plates behave in the manner consistent with the predictions outlined by this model.
4.8 It is this model's proposition that the crust/mantle boundary during the subsidence periods is cooling and becoming more viscous while the mantle itself is actually contracting and increasing its resistance to the intruding crust.
Is there evidence that some sections of the oceanic crust is actually older than the standard model estimates?
http://www.researchgate.net/publication/221939595_Lower_Cretaceous_to_Eocene_sedimentary_transverse_ridge_at_the_Romanche_Fracture_Zone_and_the_opening_of_the_equatorial_Atlantic
Lower Cretaceous to Eocene sedimentary transverse ridge at the Romanche Fracture Zone and the opening of the equatorial Atlantic
L. Gasperini (a),*, D. Bernoullib, E. Bonatti (a), A.M. Borsetti (a), M. Ligi (a), A. Negri (c),R. Sartori (d), K. von Salis (b)
(a) Istituto per la Geologia Marina, CNR, Via Gobetti 101, 40129 Bologna, Italy
(b) Geology Institute, ETH-Zentrum, 8092 Zurich, Switzerland
(c) Dip. Scienza dei Materiali e della Terra, Univ. Ancona, Ancona, Italy
(d) Dip. Scienze della Terra e Geologico-Ambientali, Univ. Bologna, Bologna, Italy
"The Romanche transform offsets the Mid Atlantic Ridge by about 900 km and is the largest of a set of major equatorial Atlantic fracture zones. Assuming for the crust adjacent to the transform an average spreading rate of 1.75 cm/yr (Cande et al., 1988) and a constant ridge/ transform geometry, the age offset of the Romanche transform is roughly 50 million years. A transform-parallel transverse ridge, running adjacent to the northern side of the fracture zone is particularly prominent for a stretch of several hundred kilometers centered opposite to the eastern ridge/ transform intersection (RTI), where the topographic anomaly reaches 4 km above the predicted thermal contraction level (Bonatti et al.,1994). Seismic reflection data and extensive rock sampling indicate that the western portion of the transverse ridge . . . . consists of slivers of uplifted oceanic crust and upper mantle (Bonatti et al.,1994). The summit of the transverse ridge is capped in this area by Miocene shallow water limestones that reached above sea level about 20 ma, and then subsided at a rate faster than that of “normal” lithospheric cooling. (Gasperini et al.,1997a). . . . .The presence of such a thick sedimentary sequence, including deep-water sediments as old as 140 Ma, less than 150 km from the RTI, does not fit a normal sea-floor spreading scenario and opening of the equatorial Atlantic."
Oceanic crust that the standard model would require to be 50 million years old is overlaid by deep-water sediments as old as 140 Ma.
These phases between the inward and outward displacement of the mantle should be easily observable in the geologic record. We should be able to see specific areas of the earth's crust where repeated periods of extensional movement was interrupted by shorter periods of compressive shortening.
https://www.researchgate.net/publication/249546906_Evidence_from_the_Gediz_Graben_for_episodic_two-stage_extension_in_western_Turkey
Evidence from the Gediz Graben for episodic two-stage extension in western Turkey
Journal of the Geological Society 156(3):605-616 · June 1999
Erdin Bozkurt, Middle East Technical University | METU · Department of Geological Engineering
A. KOCYIDIT, affiliated with Middle East Technical University (Çankaya, Turkey)
H. YUSUFODLU
Abstract
"Western Turkey falls within a wide belt of NNE-SSW-directed, active continental extension, generally similar to the Basin and Range Province of the USA. It comprises a zone of WNW-ESE-trending major grabens. Detailed study of the Gediz graben reveals two contrasting infills that represent two distinct extensional stages, separated by a short phase of compression. The older infill consists of an 800 m thick, folded and exhumed continental sedimentary sequence with intercalated calc-alkaline volcanics. It accumulated in a basin formed in the northern hanging wall of a detachment fault during Miocene-early Pliocene times. The younger infill rests on the older infill with angular unconformity and consists of about 170 m of undeformed, terraced continental sediments and basaltic lavas. It accumulated during Plio-Quaternary times in an asymmetric graben bounded by step-like normal faults. This later extension was probably triggered by the commencement of sea-floor spreading along the Red Sea in early Pliocene times and has persisted to the present. Almost all the grabens in western Turkey are best explained by this episodic, two-stage graben model with an intervening phase of short-term compression, which differs from the progressive evolution inferred for the Basin and Range Province of the USA."
Remember, we are talking about an expansion total at the current divergent boundaries of maybe 20 cm a year out of almost 40075.16 kilometers (24901.55 miles) of the Earth’s circumference. This, while the current inventory of GPE is slowly unloading as it disperses into the convergent boundaries, and raising various mountain ranges like the Himalayas to increasing heights.
-----------------------------------------------------------------------------------------------------------------
Page 10
Evidence that the
model accurately predicts
The observations of crustal behavior
------------------------------------------------------------------------------------------------------------------------------------------------------------------------------------------------------------------
5.0 Let's look again at the simple model that was shown at the beginning.
------------------------------------------------------------------------------------------------------------------------------------------------------------------------------------------------------------------
5.0 Let's look again at the simple model that was shown at the beginning.

Imagining the Earth with one single belt of sea floor around the equator (above) with one end considered attached, immovable. The other end just a short distance away unconnected. Then we apply the thermal increase that displaces the mantle and extends the crust. We can now see the gap between the plate ends open a given degree.
As seen in the examples shown previously, the magnetic field is in a constant state of change, varying in duration and intensity. At the other end of this chain of events is the crust being subjected to shear forces imposed by a displacing or subsiding mantle. I have built many things involving laminating materials into radii shapes. These are unlike materials such as metals and plastics of various densities and thicknesses. The material on the inside is able to deform in radius with little or no structural compromise, but the outside material must have either resilient qualities or a differential of allowable movement, which is the ability to move independently to compensate for the uneven rate of movement between the two layered composites.
5.1 The mantle/crust boundary is similar;
http://www.dst.uniroma1.it/sites/default/files/doglioni/E6-15-03-13-TXT.aspx.html
MANTLE DYNAMICS AND PLATE KINEMATICS
Carlo Doglioni, La Sapienza University, Rome, Italy
Roberto Sabadini, University of Milan, Italy
". . . . . none of the proposed models of mantle convection can account for the simpler pattern in plate motion we observe at the surface, nor has a unique solution been proposed for how material in the mantle convects. At the moment there is no way to link mantle dynamics and plate kinematics at the surface, considering that the mantle and lithosphere are detached. The Atlantic and Indian ridges are in fact moving apart with respect to Africa, proving not to be fixed both relative to each other and relative to any fixed point in the mantle. This evidence confirms that ocean ridges are decoupled from the underlying mantle."
"The Atlantic and Indian ridges are in fact moving apart with respect to Africa, proving not to be fixed both relative to each other and relative to any fixed point in the mantle"
This observation alone defines the mantle dynamics described by this model. The differential of allowable movement is clearly described in that statement. Add this to the earlier observation of mantle oscillations;
https://www.academia.edu/38174615/Mantle_thermal_pulses_below_the_Mid_Atlantic_Ridge_and_temporal_variations_in_the_formation_of_oceanic_lithosphere
Mantle thermal pulses below the Mid-Atlantic Ridge and temporal variations in the formation of oceanic lithosphere
"A 20-Myr record of creation of oceanic lithosphere at a segment of the central Mid-Atlantic-Ridge is exposed along an uplifted
sliver of lithosphere. The degree of melting of the mantle that is upwelling below the ridge, estimated from the chemistry of
the exposed mantle rocks, as well as crustal thickness inferred from gravity measurements, show oscillations of ,3–4 Myr
superimposed on a longer-term steady increase with time. The time lag between oscillations of mantle melting and crustal
thickness indicates that the solid mantle is upwelling at an average rate of ,25mmyr, but this appears to vary through time."
The evidence for the current outward displacement of the mantle is well supported by these two statements.
-----------------------------------------------------------------------------------------------------------------
Page 11
A model of
Seafloor dynamics
------------------------------------------------------------------------------------------------------------------------------------------------------------------------------------------------------------------
5.2 If the Earth’s crust was put under a small amount of core/mantle thermal displacement it would stretch then separate at its weakest point. The number of separations would be dependent on the amount of the differential of allowable movement. If the crust had unlimited strength one separation would suffice, but its numerous weaknesses are witness to the shear resistance the crust has to the mantle. All the divergent plate boundaries around the world began with a tension break like this.
During the mantle's outward displacement the oceanic crust that extends unbroken from its continental attachment point out to its divergent plate boundary will remain so until the point in time when its structurally weakest areas will fracture. This fracturing is based on the increased frictional drag or shear forces that are increasingly applied to the plate from its own periodically increasing metric expanse extending out to its opposing edge.
All oceanic plates will separate from this increasing shear stress. The Pacific plate did so long ago along its western continental margin and then established convergent boundaries at many of these fractures during following periods of contraction. And, in due time with greater plate width, the Atlantic will do the same.
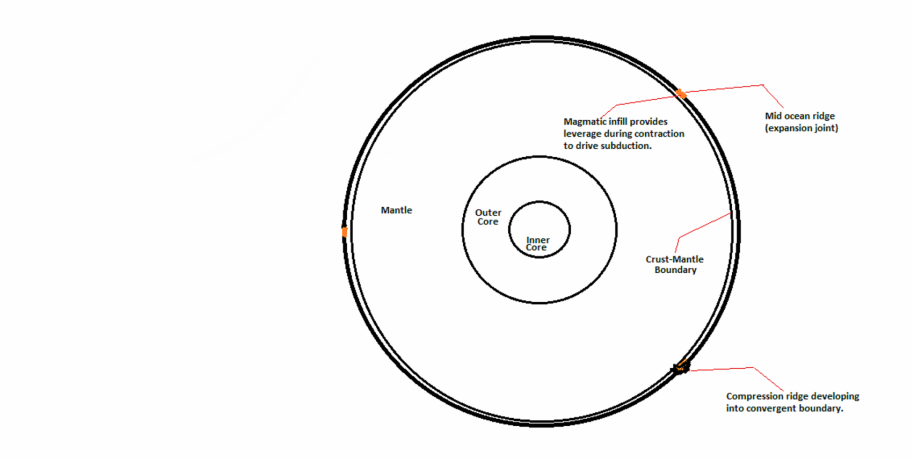
5.3 This means that when the mantle displaces outward; any oceanic plate that cannot relieve the tension derived from either its own extreme plate width, or, due to it having its opposing plate ends held by subduction, as in having been overran and held by a continent or another oceanic plate, the plate will fracture at its weakest point. And of course, as described previously, these newly created divergent plate boundaries can be converted at a later time into a convergent plate boundary when the mantle once again begins to subside and the Earth's crust will need to relieve the growing GPE through the compression relieving mechanisms known as convergent boundaries.
"Eventually the magnetic field energy lowers and the outer core contracts placing the crust in compression against the most recent deposits of seafloor. The first subductions probably began during that time long ago when all that existed was proto crust beneath a shallower ocean. When the compression reached a critical level a compression ridge formed at one of the weaker divergent boundaries. As it failed under the increasing pressures it became a convergent boundary as one edge subducted under the other."
Is there any evidence of these very specific events occurring?
https://www.researchgate.net/publication/309737839_Rapid_conversion_of_an_oceanic_spreading_center_to_a_subduction_zone_inferred_from_high-precision_geochronology
Rapid conversion of an oceanic spreading center to a subduction zone inferred from high-precision geochronology
Timothy E. Keenan (a), John Encarnación (a1), Robert Buchwaldt (b), Dan Fernandez (c), James Mattinson(d), Christine Rasoazanamparany (e), and P. Benjamin Luetkemeyer(a)
Author Affiliations
aDepartment of Earth and Atmospheric Sciences, Saint Louis University, St. Louis, MO 63108;
bDepartment of Earth and Environment, Boston University, Boston, MA 02215;
cSchlumberger-WesternGeco, Geosolutions-Interpretation, Houston, TX 77042;
dDepartment of Earth Science, University of California, Santa Barbara, CA 93106
eDepartment of Geology and Environmental Earth Science, Miami University, Oxford, OH 45056
Edited by W. G. Ernst, Stanford University, Stanford, CA, and approved October 11, 2016 (received for review June 20, 2016)
Significance
"Subduction, the process by which tectonic plates sink into the mantle, is a fundamental tectonic process on Earth, yet the question of where and how new subduction zones form remains a matter of debate. In this study, we find that a divergent plate boundary, where two plates move apart, was forcefully and rapidly turned into a convergent boundary where one plate eventually began subducting. This finding is surprising because, although the plate material at a divergent boundary is weak, it is also buoyant and resists subduction. This study suggests that buoyant, but weak, plate material at a divergent boundary can be forced to converge until eventually older and denser plate material enters the nascent subduction zone, which then becomes self-sustaining."
Abstract
"Where and how subduction zones initiate is a fundamental tectonic problem, yet there are few well-constrained geologic tests that address the tectonic settings and dynamics of the process". . . . . . . . . . . "In the western Philippines, we find that oceanic crust was less than ∼1 My old when it was underthrust and metamorphosed at the onset of subduction in Palawan, Philippines, implying forced subduction initiation at a spreading center. This result shows that young and positively buoyant, but weak, lithosphere was the preferred site for subduction nucleation despite the proximity of other potential weak zones with older, denser lithosphere and that plate motion rapidly changed from divergence to convergence".
The divergent boundary "was forcefully and rapidly turned into a convergent boundary". This does not describe the current model's passive process: "of other potential weak zones with older, denser lithosphere"
"young and positively buoyant, but weak, lithosphere was the preferred site for subduction nucleation"
"plate motion rapidly changed from divergence to convergence".
-----------------------------------------------------------------------------------------------------------------
Page 12
A model of
Convergent dynamics
------------------------------------------------------------------------------------------------------------------------------------------------------------------------------------------------------------------
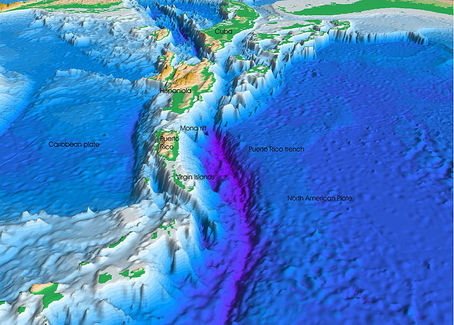
Image above courtesy of USGS
5.4 Let’s apply this mechanism to one of these newly converted "divergent/convergent" boundaries like the one in the study above; one that will eventually develop a string of volcanic Island Arcs.
When the core's thermal cycle causes the mantle to subside, this “thermal contraction” will produce gravitational potential energy in the crust that in turn provides the compression to advance the ocean crust under the overlying continental-oceanic crust. This process would undoubtedly force the overlying crust to be lifted up. At a point behind the convergent zone determined by the structural deficiencies of the overriding plate, the overriding plate will fracture.
These fractures are directly correlated to the subducting plate being forced under the overriding plate. When the “thermal expansion” portion of the thermal cycle begins again, the Earth’s crust is slowly radially extended, opening all divergent plate boundaries to the inflow of fresh magma, including these newly created and fractured back-arc basin spreading centers.
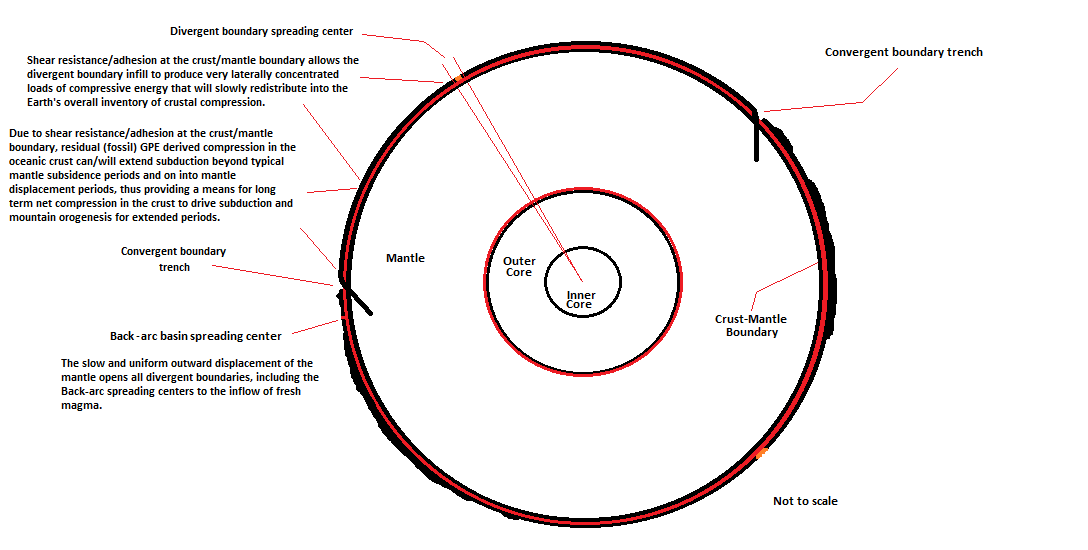
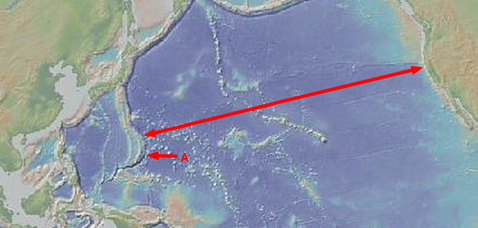
5.41 The deep oceanic trenches are put into tension when the upper mantle is periodically extended to unusual levels of expansion that removes all or most of the GPE in those particular crustal plate sections. These are periods when the mantle once again begins to slowly displace outward after a longer than usual period of lower magnetic field strength where the compression in the crust has had the additional time to largely dissipate and can thus allow tension to form in the larger continental and oceanic plates.
The resulting tension causes the oceanic crust to pull against its fixed position in the subducted convergent boundary zone, pulling back on the edge of the oceanic crust where it is bent downward. This tension force is proportional to the distance to the divergent plate boundary. A section of oceanic crust that is 1000 km between the trench and mid ocean ridge will have twice the tension at the trench edge and twice the allowable movement at the divergent boundary; during expansion, as one that is 500 km.
Image above used and modified by this author was furnished through and in no way endorsed by://www.geomapapp.org using Global Multi-Resolution Topography (GMRT) Synthesis,
Ryan, W. B. F., S.M. Carbotte, J. Coplan, S. O'Hara, A. Melkonian, R. Arko, R.A. Weissel, V. Ferrini, A. Goodwillie, F. Nitsche, J. Bonczkowski, and R. Zemsky (2009), Global Multi-Resolution Topography (GMRT) synthesis data set, Geochem. Geophys. Geosyst., 10, Q03014, doi:10.1029/2008GC002332.
Data doi: 10.1594/IEDA.0001000, through http://creativecommons.org/licenses/by-nc-sa/3.0/us/
This is why I believe the Mariana trench (A) (Image above) is the deepest trench in the world; it has the most applied tension because its latitudinal ocean crust section of that area of the Pacific Plate is unusually wide causing the arc shape to form with an unusually deep convergent trench. More lateral distance = more applied tension. More lateral distance = more divergent boundary movement (Fig. 1).

5.5 But there is an additional element to the Mariana tension mechanism; around 28 million years ago the mid-ocean ridge and a portion of the Pacific Plate itself on its eastern plate margin had been overrun and held by the North American continent (Fig. 2), resulting in the trench opening being spread wider and deeper than it would be with just having a long expanse of oceanic crust terminating at the Mid-Ocean Ridge (Fig. 1). This was for a very short period of time that occurred immediately after the Pacific plate divergent boundary followed the Farallon into the subduction zone. And it ended when the next mantle thermal pulse began and slowly pulled the plate end back to the west. Another dynamic was introduce at this time when the northwest direction of the Pacific plate was applied to this boundary as the pacific plate subducted and then retracted while moving in the northwest direction. This would undoubtedly produce a extraordinary result as the Pacific plate end laterally excavated the area beneath N.A. plate margin as the plate withdrew and established the currently observed San Andres margin plate boundary dynamics.
When just one end of the plate is held by the trench the allowable movement at the divergent boundary will moderate the tension in an ebb and flow of tension and movement (Fig. 1) as the crust slides to relieve the tensile stresses caused from the underlying shear forces that occur as the mantle displaces outward.
When just one end of the plate is held by the trench the allowable movement at the divergent boundary will moderate the tension in an ebb and flow of tension and movement (Fig. 1) as the crust slides to relieve the tensile stresses caused from the underlying shear forces that occur as the mantle displaces outward.

But in the Pacific the allowable movement mechanism became almost completely eliminated in this plate section when the Pacific Plate was overran and held by the North American land mass (Fig. 2).
Before this event occurred the expansion force of the outwardly displacing mantle gradually separated the Pacific Plate and the now subducted Farallon Plate. A differential, or "allowable" movement occurred between the crust and mantle as the Pacific Plate divergent boundary edge was pulled westward creating the gap between the plates that we refer to as the East Pacific Rise (Fig. 3 below)

It is this gap that fills with magma creating new seafloor as the allowable movement satisfies the building tension. With this stress relieving element removed the trench is subjected to larger and longer periods of tension. More applied tension without allowable movement = wider and deeper trenches.
-----------------------------------------------------------------------------------------------------------------
Page 13
A model for
Extensional dynamics
------------------------------------------------------------------------------------------------------------------------------------------------------------------------------------------------------------------
In the model the Farallon plate had been subducted under N. America at a very shallow trajectory. It was subducted horizontally just under the western margin of the N. American continental crust. And this was an important part of the mechanism that was involved with extending that region out to its current dimensions.
Image below used and modified by this author was furnished through and in no way endorsed by://www.geomapapp.org using Global Multi-Resolution Topography (GMRT) Synthesis,
Ryan, W. B. F., S.M. Carbotte, J. Coplan, S. O'Hara, A. Melkonian, R. Arko, R.A. Weissel, V. Ferrini, A. Goodwillie, F. Nitsche, J. Bonczkowski, and R. Zemsky (2009), Global Multi-Resolution Topography (GMRT) synthesis data set, Geochem. Geophys. Geosyst., 10, Q03014, doi:10.1029/2008GC002332.
Data doi: 10.1594/IEDA.0001000, through http://creativecommons.org/licenses/by-nc-sa/3.0/us/

5.51 In the S.W. United States there is the Basin and Range area (B, inside black outline), the area's lateral displacement varies between 60 to 300 km since the beginning of the extension in the early Miocene. The Miocene Epoch was 23.03 to 5.3 million years ago. Currently there is no clear and concise explanation for this event.
What is remarkable though, is that the particular latitudinal section of Pacific oceanic seafloor that had been partially subducted, or more accurately, overran by the N. American continent, extends all the way to the Mariana Trench (A) in the western Pacific.
Interesting isn't it. The deepest trench in the world is on one end; and the largest example of extensional processes is on the other.
What is also interesting and a relevant development is this recent paper that reveals a shallow subduction regime has been modeled;
https://confit.atlas.jp/guide/event/jpguagu2017/subject/SIT29-01/detail?lang=en
S (Solid Earth Sciences) » S-IT Science of the Earth's Interior & Tectonophysics
New perspectives on East Asia geodynamics from the crust to the mantle
Tue. May 23, 2017 9:00 AM - 10:30 AM A03 (Tokyo Bay Makuhari Hall)
convener:Timothy B Byrne(University of Connecticut), Gaku Kimura(Tokyo University of Marine Science and Technology), Jonny Wu(University of Houston), Kyoko Okino(Atmosphere and Ocean Research Institute, The University of Tokyo), Chairperson:Tim Byrne(University of Connecticut), Chairperson:Okino Kyoko(Atmosphere and Ocean Research Institute, The University of Tokyo)
"Seismic tomography has revealed enigmatic stagnant slab anomalies under Japan, Korea and NE China (i.e. the Japan slab). The stagnant slabs flatten near the mantle transition zone around ~410 to 660 km depths and extend >2000 km westward from the NW Pacific subduction zones. The location of the outboard stagnant slabs far inland under Eurasia cannot be explained by slab rollback alone and pose a challenge to our current understanding of subducted slab dynamics, in which slabs sink vertically over time with minimal lateral motion."
"Our reconstruction implies the Japan slabs moved laterally westwards within the upper mantle and transition zone after subduction at near-plate tectonic rates (~2 cm/yr over 50 Ma), indicating a greater lateral mobility of slabs within the upper mantle and transition zone than previously recognized."
5.52 Now, if we could imagine that this type of subduction described above is not a rare occurrence at all, and instead is a very common form of subduction. And if we could further imagine that one of these very shallow subducted plates was again the Pacific, but instead, this time, it was the opposite subducted edge on the Pacific plate's eastern margin, and that it had simply followed and then subducted alone with the Farallon plate that had just prior to this been completely overran up to when its divergent boundary was consumed under the overriding continent, with the Pacific plate simply following and then moving under the edge of the Farallon plate.
https://www.iris.edu/hq/NSFProposal/Volume2/Lith.pdf
Lithospheric Layering in the North American Craton
Huaiyu Yuan (Berkeley Seismological Laboratory),
Barbara Romanowicz (Berkeley Seismological Laboratory)
"Recent receiver function studies detect structural boundaries under continental cratons at depths too shallow to be consistent with the lithosphere-asthenosphere boundary (LAB) as inferred from seismic tomography and other geophysical studies. Using the new results from our regional surface wave tomographic inversion for the North American upper mantle shear wave structure, we show (Figure1) that changes in the direction of azimuthal anisotropy with depth reveal the presence of two distinct lithospheric layers throughout the stable part of the North American (NA) continent [Yuan and Romanowicz, 2010]."
. . . . ."American craton may be exceptionally simple, the application of this tool to other continents should provide further insights on the assembly and evolution of cratons worldwide."
If we look back to the description this model made earlier of the; "initial development and evolution of plate tectonics" we can see a very similar scenario described, in fact an almost identical scenario. Multiple layers of oceanic crust subducted one after another, each time after the plate had broke during the intermittent outward displacement periods. We can imagine that the plate would have been loaded with considerable tension before it was broken free, and may have imposed these tension forces as a great shear stress into the overriding crust, even stretching it out as it broke the over-riding crust into many parallel segments.
And now, if we reexamine the Basin and Range Province and its relationship to the Pacific plate we could deduce a cause for the extension of that area of continental crust.
5.53 The eastern side of Pacific shows distinct sections of seafloor that have defined fault slip edges; the Mendocino to the north, followed by in consecutive order to the south; Murray, Molokai and Clarion, that have facilitated the crustal section's differential of movement. After a series of possibly several cycle periods the model has the Pacific Plate over ran and held by the North American continent and the Farallon plate that lies directly beneath it. With the divergent boundary movement eliminated, the boundary compression in these plate sections was reduced as the existing GPE slowly drained away into the convergent boundaries on the western margin of the plate.
As the cycle then changed to thermal expansion of the core with its accompanying mantle displacement occurring directly below the Basin and Range, the Pacific plate section was loaded with slowly increasing tension, and due to its inability to move through tension relieving mechanisms such as the Pacific Ridge does currently at various locations in the Southern Hemisphere, this tension was passed on to the overriding plate that kept it from relieving its growing tensional strain. That boundary's subduction under the edge of the N. American continent eliminated all or most of the boundary's ability to function as a standard tension relieving mechanism like the Atlantic MOR does. The Basin and Range was pulled instead as the Pacific plate moved north and excavated itself out from under the overlying continent, possibly leaving the Central Valley a void to drop down into, while the Mariana Trench was pulled toward the east. This is clearly observed in the images below.
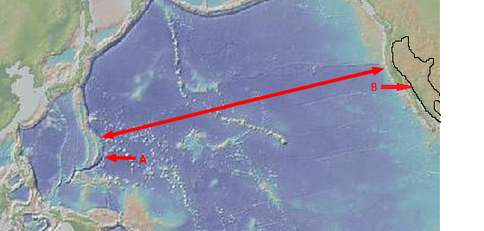
|
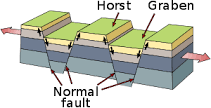
|
The Mariana Back-Arc clearly exhibits the evidence that it has behaved as a tension relieving mechanism, leaving its series of progressive compression ridges marking the periods when the back-arc expansion had ended and the various boundaries were then subjected to prolonged periods of crustal compression. While the Basin and Range clearly shows the extensional Horst and Grabin terrain exhibiting normal faults of opposite dip that occur in pair with parallel strike lines.
-----------------------------------------------------------------------------------------------------------------
Page 14
A model of
Convergent boundary dynamics
------------------------------------------------------------------------------------------------------------------------------------------------------------------------------------------------------------------
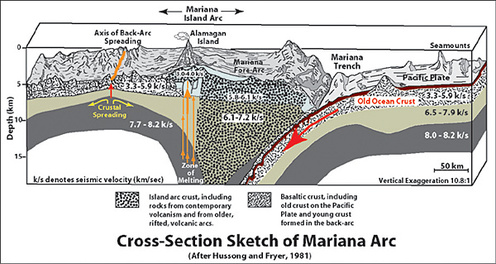
This 3-D sketch (left) shows a cross-section of the Mariana Arc with some of its main structures and features. The numbers represent the speed of sound in the various layers beneath the arc measured by the precise timing arrivals from earthquakes and man-made sources. Higher velocities represent more dense material. Note that there is old ocean crust descending in the trench at the same time new crust is forming along the island arc (from deep melting of the down going plate) and in the back-arc spreading center (from extension behind the arc). Modified from Plate 2 of Fryer and Hussong (Proceedings of the Deep Sea Drilling Project, Leg 60, pp. 45-55, 1981). Image and text courtesy NOAA Ocean Explorer.
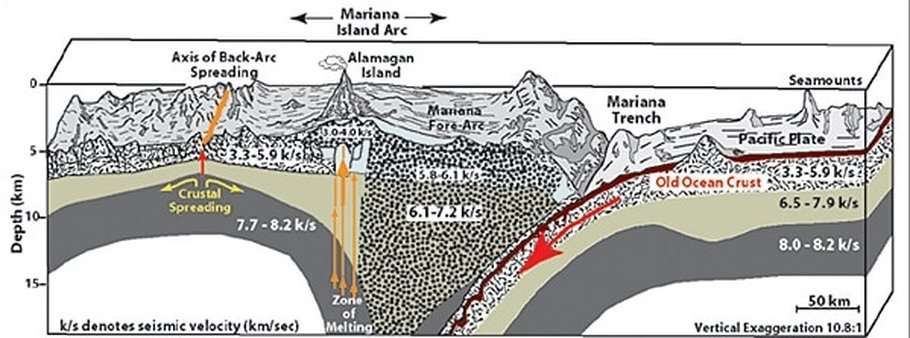
5.6 When the core's thermal cycle changes once again from expansion to thermal contraction and the upper mantle moves back towards the core; most isolated areas of tension, like which was described above with the Pacific, is slowly replaced by compression; incrementally increasing the crust's inventory of GPE derived compression that is then slowly released against the planet's divergent boundaries newest magma deposits. This process would of course show a direct correlation between an oceanic plate's subducting angle and the distance to its opposing divergent boundary, and too, that boundary's proportional magmatic infill. When the mantle begins to subside; the greater that the ocean plate's expanse is, the greater the magma infill will be, which results in proportional compressional energies attained at the trench. The greater the plate is; the larger the tensional and compressional energies that will occur during the thermal cycle.
This prediction of course determines the ultimate speed that the plate will obtain. Wider plates = faster divergent boundaries metrics which = larger infills which = greater gravitational potential energies which = greater compressional plate energies which = greater subduction rates.
https://www.sciencedaily.com/releases/2010/07/100716125841.htm
Currently; "the Australian, Nazca and Pacific plates move up to four times faster than the smaller African, Eurasian and Juan de Fuca plates. The ancient Farallon plate that sank into the mantle below North and South America. This plate slowed down during eastward motion from about 10 centimeters (four inches) per year some 50 million years ago to only 2 centimeters (0.8 inches) per year at present,"
The subducted section of ocean plate is now moving down deeper, the crust moving as the compression is released. As these thermal cycles repeat over tens of millions of years the subducted plate edge is stretched and slightly flattened by periodic extreme tension episodes that occur every five to ten thermal cycles, after which the particular ocean plate resumes the subduction that is otherwise almost continually driven by the compression in the crust. The periodic extreme tension that produce the stretch and flattening of the subducted plate section will pull the back-arc towards the trench during these rarer thermal expansion periods when the GPE in the crustal section is almost completely eliminated and the plate can thus be stretched between its two opposing ends. As was the case that resulted with the Mariana Trench being diametrically opposed to the Basin and Range Province.
When the subducted plate is pulled back its underside moves against the transitional boundary that it is in-bedded into, causing the subducting plate to move up and back under the overriding plate. This more extreme extension of the volcanic arc system towards the trench allows increased magma influx in the back arc fracture that keeps the island arc from regressing during the next compression period when the ocean plates will continue their more standard subduction again.
Those same periodic extreme tension periods that first broke the ocean plate away from the continent and then later periodically advance the island arcs towards the trench would undoubtedly re-fracture any large oceanic plates adjacent to where it is held in a convergent trench.
A remarkable research paper has been published that has changed the common understanding of convergent boundary dynamics while simultaneously supporting this model’s understanding of mantle dynamics and its ability to predict the research paper’s conclusions.
https://www.researchgate.net/publication/311446628_Metamorphic_record_of_catastrophic_pressure_drops_in_subduction_zones
Metamorphic record of catastrophic pressure drops in subduction zones
December 2016, Nature Geoscience 10(1)DOI:10.1038/ngeo2852
Philippe Yamato, Université de Rennes
Jean-Pierre Brun, Université de Rennes 1
Abstract
“When deeply buried in subduction zones, rocks undergo mineral transformations that record the increase of pressure and temperature. The fact that high-pressure metamorphic parageneses are found at the Earth’s surface proves that rock burial is followed by exhumation. Here we use analysis of available data sets from high-pressure metamorphic rocks worldwide to show that the peak pressure is proportional to the subsequent decompression occurring during the initial stage of retrogression. We propose, using a simple mechanical analysis, that this linear relationship can be explained by the transition from burial-related compression to extension at the onset of exhumation. This major switch in orientation and magnitude of principal tectonic stresses leads to a catastrophic pressure drop prior to actual rock ascent. Therefore, peak pressures are not necessarily, as commonly believed, directly dependent on the maximum burial depth, but can also reflect a change of tectonic regime. Our results, which are in agreement with natural data, have significant implications for rock rheology, subduction zone seismicity, and the magnitudes of tectonic pressures sustained by rocks. Current views of subduction dynamics could be reconsidered in that perspective.”
What these researchers found was exactly what this model predicted; that a subducting plate that was loaded prior with GPE derived compression would be subjected to periodic tension as the oceanic plate was displaced during a typical mantle thermal pulse period when its subducted plate end was held fixed within the crust/mantle boundary while the connected seafloor portion was subjected to the shear forces of the mantle pulse displacing the mantle.
The portion of the subducted plate that had been experiencing compression pressures higher than even the relative depth would impose was almost instantaneously put in tension and recorded mineral transformations that exhibit the preliminary increase of compression pressure and then sudden catastrophic pressure drop that occurred from the mantle thermal pulse prior to actual rock ascent to the surface.
The researchers state that these findings appear in many settings;
“However, other field examples clearly show that exhumation occurred in extension (regardless of P–T estimates), driven either by slab rollback (for example, Mediterranean15) or by extension of the overriding plate (for example, Norwegian Caledonides14,18 or Papua New Guinea25). It is remarkable that, whatever the tectonic setting, P–T data respect the same linear relation between peak pressure and pressure drop (Figs 1b and 3a), indicating that even where extensional exhumation is not obvious a transition from compression to extension probably occurred.”
There is a really great short analysis of this paper;
https://grumpygeophysicist.wordpress.com/2021/03/18/depressurizing-geobarometry/
-----------------------------------------------------------------------------------------------------------------
Page 15
Evidence of repeated episodes of
Slab advance, slab retreat and slab break-off
------------------------------------------------------------------------------------------------------------------------------------------------------------------------------------------------------------------
5.61 Is there evidence of these cycles in the geologic record? Evidence of repeated episodes of the model's mantle thermal pulses of 3-4 million year intervals? Episodes of slab advance and slab retreat, slab break-off that is then followed by subduction?
https://www.researchgate.net/publication/274265622_Repeated_slab_advance-retreat_of_the_Palaeo-Pacific_plate_underneath_SE_China
https://www.researchgate.net/figure/Cartoons-showing-a-repeated-slab-advance-retreat-model-a-ca-197-Ma-fl-at-slab_fig12_274265622
Repeated slab advance–retreat of the Palaeo-Pacific plate underneath SE China
Yao-Hui, Jiang; Guo-Chang, Wang; Liu, Zheng; Chun-Yu, Ni; Long, Qing; Zhang, Qiao
(2015): Repeated slab advance–retreat of the Palaeo-Pacific plate underneath SE China. figshare.
http://dx.doi.org/10.6084/m9.figshare.1328415Retrieved 04:37, Sep 08, 2015 (GMT)
"Integrating these observations, we propose a repeated slab-advance–retreat model for the late Mesozoic magmatic evolution of southeast China. Palaeo-Pacific plate subduction underneath southeast China initiated in the Late Triassic Rhaetian and reached southern Jiangxi by ca. 197 Ma, followed by slab rollback during 197–191 Ma and by slab break-off at ca. 189 Ma. Then slab advance was reestablished with the northwestward subduction approaching southern Hunan at ca. 178 Ma. From ca. 174 Ma, slab rollback reinitiated and gradually migrated from inland to the coastal area. This repeated slab-advance–retreat model is helpful to further understand the geodynamic mechanism of the late Mesozoic tectono-magmatism and related metallogenesis of southeast China."
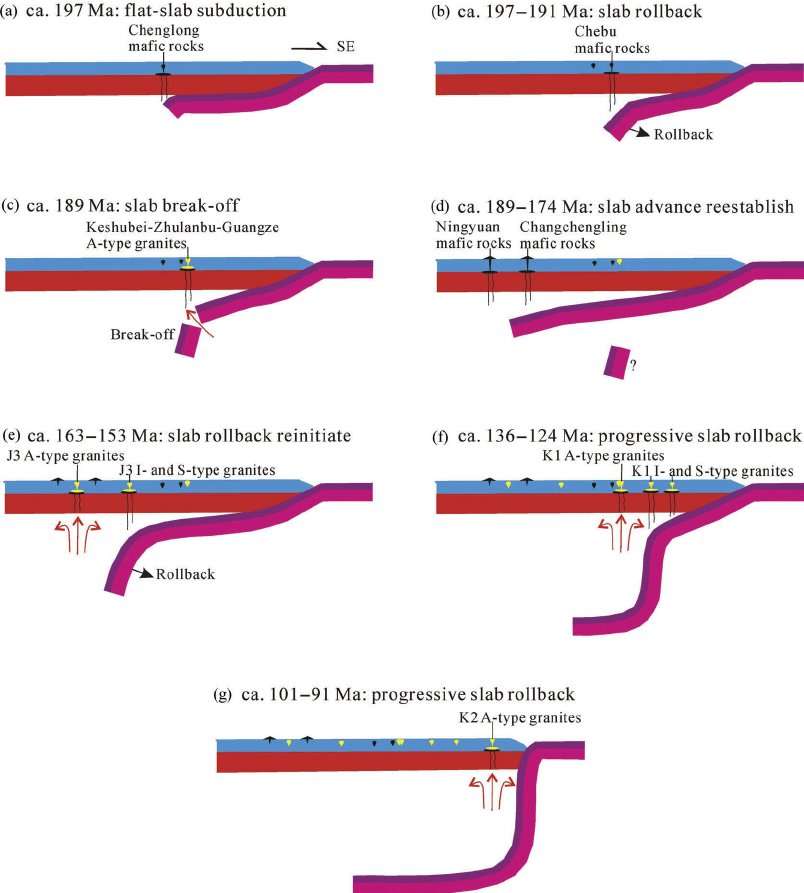
-----------------------------------------------------------------------------------------------------------------
Page 16
Prediction of
Double Benioff Zones
------------------------------------------------------------------------------------------------------------------------------------------------------------------------------------------------------------------
http://neic.usgs.gov/neis/eq_depot/2006/eq_061115_vcam/neic_vcam_c.html
The graph above and below are from USGS Earthquake Hazards Program. They show Magnitude 8.3 Kuril Islands earthquake Wednesday, November 15, 2006 at 11:14:17 UTC Seismicity Cross Section A to A at left and then below show slip on the fault and within the down going plate. Current research attributes the seismicity as a result of bending and extension as the plate is pulled into the mantle.
5.7 According to this model the thermal expansion of the mantle is the likely source of double Benioff zones. Benioff zones were believed to be of a single layer of earthquake activity. Recent earthquake data has given a more accurate picture of Benioff zones and they show that almost all subduction zones have two parallel layers of earthquake activity. High pressure below 70 km (43.5 miles) should prohibit the release of strain that leads to earthquakes, but earthquakes at the Benioff zone can be as deep as about 700 km. I believe these are happening because of the currently occurring thermal expansion portion of the cycle.
As the mantle is slowly displaced it imparts shear force into the subducted plate. These forces produce tension at the subducted end of the plate where the displacing mantle is holding and applying tension to the embedded end, pulling it and reducing the deep compression forces that normally prevents the release of the deeper seismic energy. These acceleration/deceleration dynamic forces in the plate would simultaneously accommodate the currently observed subduction that is processing the present inventory of fossil gravitational potential energy that is in the planet's largest tectonic plates. In time, as the cycle of mantle displacement wanes, so would the deeper seismic activity, while the overall subduction may proportionally decrease or increase in response based on the amount of gravitational potential energy that will be realized as the mantle subsides and increasingly produces this driver of subduction.
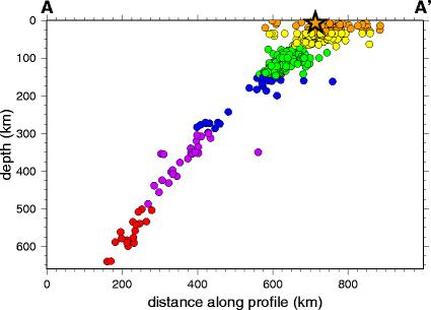
Wednesday, November 15, 2006 at 11:14:17 UTC Seismicity Cross Section
The tension caused by the mantle's expansion momentarily reduces the extremely deep (600 km) compressive energy caused by the fossil gravitational potential energy and allows the deep seismic activity. There is a good probability that there is an occasional random broken plate end piece under or even over the bent edge of the ocean crust, broken loose from extreme thermal expansion periods when the crust cannot accommodate the developing tension through other means. When the crust is again compressed into the trench it will likely overlap or subduct under the previously embedded section, reestablishing subduction on top or under the old broken plate end.
The tension caused by the mantle's expansion momentarily reduces the extremely deep (600 km) compressive energy caused by the fossil gravitational potential energy and allows the deep seismic activity. There is a good probability that there is an occasional random broken plate end piece under or even over the bent edge of the ocean crust, broken loose from extreme thermal expansion periods when the crust cannot accommodate the developing tension through other means. When the crust is again compressed into the trench it will likely overlap or subduct under the previously embedded section, reestablishing subduction on top or under the old broken plate end.
-----------------------------------------------------------------------------------------------------------------
Page 17
Processing of accumulated
Sedimentary materials at convergent margins
------------------------------------------------------------------------------------------------------------------------------------------------------------------------------------------------------------------
5.8 There has been questions raised for the lack of sediments that should accumulate at the trenches over millennia, but the reciprocal movement of the trench opening allows the material to fall in deeper during expansion when the trench is pulled open wider. Then the material is compressed and subducted during contraction in a gravity fed conveyor that can process the volume efficiently. The trench opening width is partially determined by the crust's ductile properties in relation to the subducted plate angle. The tension applied is dependent on the distance to the divergent plate boundary. As the Pacific plate is gradually reduced in size in the future the shear forces that apply tension at the convergent trench will expand the divergent plate boundary in gradually decreasing widths while leaving the convergent trenches with ever decreasing applied tension during the expansion cycle.
I think those trenches are as wide as they will ever get. Some of the vertical movement in the overriding plate is the result of the repeated bending and straightening during the expansion-contraction cycles. This facilitates additional pulling traction between the subducted plate and the volcanic arc system that is overriding the subducted plate. It also transports the large volume of sedimentation materials and ocean water that are taken deep into the interior to be converted into magma and rock.
Images 1,2,3,4 and 5 used and modified by this author in the following section were furnished through and in no way endorsed by http://www.geomapapp.org using Global Multi-Resolution Topography (GMRT) Synthesis,
Ryan, W. B. F., S.M. Carbotte, J. Coplan, S. O'Hara, A. Melkonian, R. Arko, R.A. Weissel, V. Ferrini, A. Goodwillie, F. Nitsche, J. Bonczkowski, and R. Zemsky (2009), Global Multi-Resolution Topography (GMRT) synthesis data set, Geochem. Geophys. Geosyst., 10, Q03014, doi:10.1029/2008GC002332.
Ryan, W. B. F., S.M. Carbotte, J. Coplan, S. O'Hara, A. Melkonian, R. Arko, R.A. Weissel, V. Ferrini, A. Goodwillie, F. Nitsche, J. Bonczkowski, and R. Zemsky (2009), Global Multi-Resolution Topography (GMRT) synthesis data set, Geochem. Geophys. Geosyst., 10, Q03014, doi:10.1029/2008GC002332.
- Data doi: 10.1594/IEDA.0001000, through http://creativecommons.org/licenses/by-nc-sa/3.0/us/
-----------------------------------------------------------------------------------------------------------------
Page 18
A prediction of
Divergent boundary development
------------------------------------------------------------------------------------------------------------------------------------------------------------------------------------------------------------------
If this overall hypothesis is correct I would expect to see the latitudinal sections of oceanic crust that were historically the widest to be outpacing the narrower sections in ascendancy. Sometime earlier after the formation of the Pacific divergent plate boundary, but still a time when the axis was mostly aligned, these wider sections would begin to noticeably outpace the narrower sections with infill. The evidence in this would be the wider sections are retracted at the divergent boundary farther during the thermal expansion portion of the cycle than the narrower sections are because they have the greater portion of the differential of movement that a wider plate would have over its adjacent match.
6.0 This would allow more magma to fill the divergent boundary on the widest plate's side of the ridge axis. And in time as the thermal cycles repeat, that side of the axis would start to outpace the opposing latitudinal sections in the amount of magma infill. The ocean crust could adjust a little, but would eventually fracture in regular segments across the divergent axis. As tens of millions of years passed we would see large and ever growing fracture zones containing transform faults evenly distributed along the axis. The axis segments within the fracture zones would show in proportion the amounts of the differential movements each latitudinal section can attain when the boundary responds to the mantle displacement cycles.
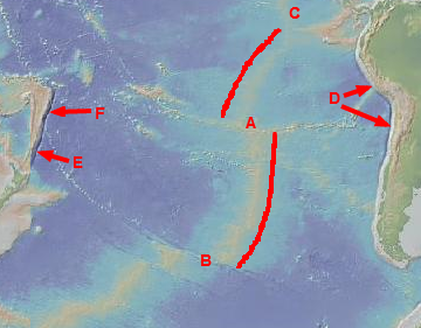
Image 2. Such a pattern is visible in current relief maps of the Pacific Ocean floor. In the southern Pacific one can see the pattern in the western side of the ridge between the Challenger (A) and Eltani (B) fractures, it being the dominate half with the most allowable movement. It's inferior counterpart is an expanse of Antarctic plate that is fractured and faulted and is currently being extruded through the Strait of Magellan into what is now the separate Scotia Plate. The opposing and dominant seafloor subducts into the Kermadec (E) and Tonga (F) Trenches.
While North of Challenger (A) to just before the Galapagos Islands (C) the eastern side looks to have gained the most material in contradiction to this point but the current seafloor on the eastern side of the ridge has been in almost continuous subduction at (D) since the birth of the Atlantic that gradually moved the American continents west since that point in time. The wide expanse of that pre-subducted plate dominated the smaller inferior western side of the ridge and in doing so offset the ridge to that direction.
6.1 Thus, when either one of two opposing oceanic plates first fails and separates from its adjoining continent, it would undoubtedly precede its opposing plate section's eventual failure by a substantial period of time. This would allow that still attached section the lead time to establish and maintain a slowly increasing numerical advantage of additional ridge infill on that plate section's side of the ridge axis. This advantage is due to the additional differential of allowable movement that a still attached plate has over its opposing detached twin. These crescent sections of ridge that we now observe bear witness and give measure to that distant time period.
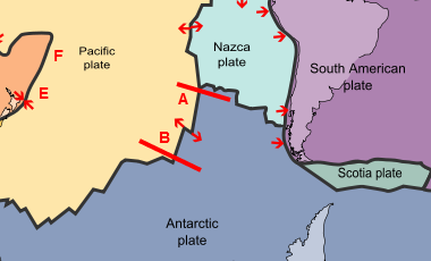
In this USGS image you can see the plate boundaries in their relative sizes and respective positions. Challenger (A) and Eltani (B) fractures are shown as are the Kermadec (E) and Tonga (F) Trenches.
6.2 If one was to take a world ocean floor relief map and realign the axis of the ocean ridge sections to their historic alignment, one could see that in each case the ocean crust sections with the most distance to the adjacent divergent boundary trench had the most differential of allowable movement and gained the most ridge material.
And in doing so offset its axis in the opposite and inferior direction to the greater degree. This phenomenon is only relevant where one oceanic plate has a large advantage over the opposing plate, such as when the inferior plate is being reduced through subduction. And as time passes, inversely multiplying the small advantage the larger plate has.
This model would predict that these dynamics would eventually change from the initially superior side to the inferior side, and that many of the plate sections that now show evidence of past superior advantage will now in fact have current boundary axis metrics in the opposite dynamic.
For example; if the opposing overriding plate that is slowly consuming the inferior plate at a convergent boundary resembles something like that of the current arrangement of the N. American continent with its attached Atlantic oceanic crustal margin, this model would predict that the slowly increasing divergent boundary metric expanse on its Atlantic oceanic plate margin would produce a gradually increasing superior bias in counteraction to the Pacific divergent margins now comparably slower and decreasing metric rate. This would allow the divergent boundary plate remnant that now lies under the edge of the N. American western margin to be pulled by the combined metric expanse of the N. American continent and its adjoined oceanic plate section as the repeated mantle cycles incrementally displace the Pacific divergent boundary. Thus, we would see these various boundaries shift their spreading rates from one side of the boundary axis to the other as the adjoining continental/oceanic plate sections slowly increase or decrease their metric expanse in response to the changing plate dynamics that greatly influence the boundary axis metrics.
-----------------------------------------------------------------------------------------------------------------
Page 19
A model for
Atlantic divergent boundary dynamics
-----------------------------------------------------------------------------------------------------------------------------------------------------------------------------------------------------------------
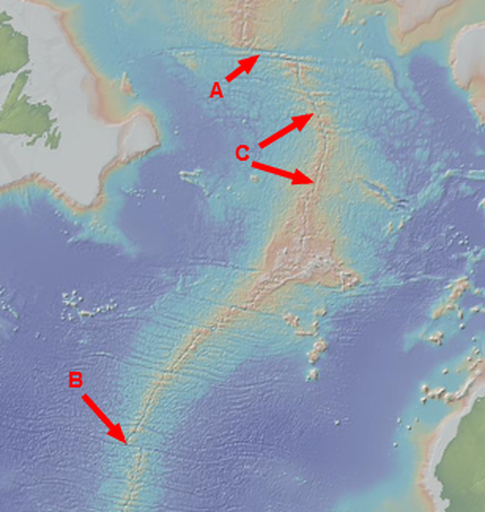
Image 4. As a comparison a divergent boundary such as the North Atlantic's (Left) has almost uniform latitudinal distances with a serpentine configuration showing little axis misalignment, neither side having a dominant allowable movement. The distance between the Charlie Gibbs Fracture Zone (A) and the Kane Fracture Zone (B) is over 4200 km’s.
6.3 The ridge area C is what I would expect a Mid-Ocean ridge (MOR) would look like early in its beginnings. Notice the lack of fracture zones in this area. To the south is the large Chain fracture zone area (not shown) that has an enormous offset to the axis. And further to the south are some of the better examples of the ridge's offset segments.
6.3 The ridge area C is what I would expect a Mid-Ocean ridge (MOR) would look like early in its beginnings. Notice the lack of fracture zones in this area. To the south is the large Chain fracture zone area (not shown) that has an enormous offset to the axis. And further to the south are some of the better examples of the ridge's offset segments.
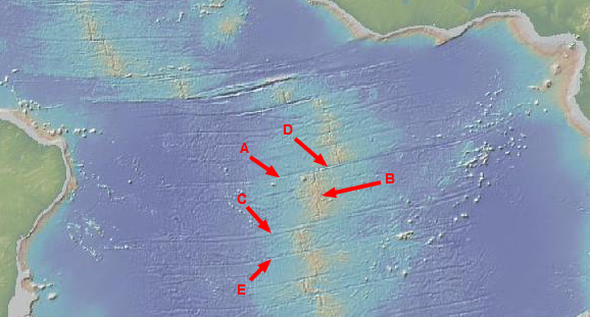
d Image 5. The opposing divergent sea floor and the continent's latitudinal similarity mirrors the ridge axis misalignment. The (MOR) section (B) between the Ascension Fracture Zone (A) to the north and the Bode Verde (C) to the south has a latitudinal distance imbalance from continental shelf to the ridge axis center of not more than 100 km out of the 2400 km of seafloor production on either side of the ridge, and taking the unknown continental shelf erosion into account, I assume they are almost equal in infill.
6.4 The section has a ridge axis misalignment (D) with the adjacent section to the north of 250 km +/-. Just to the south the next MOR section, which is bordered to the south by the Cardno Fracture Zone (E), has a ridge axis misalignment with the adjacent section to the north of 215 km +/- while the latitudinal distances to the continents are 2450 km +/- to the west and 2750 km +/- to the east, the imbalance is within the inaccuracy of the method of measurement. The MOR offset could be due to the east having more magma infill from more allowable movement but I think this has not yet developed into a measurable value compared to the overall ridge infill from uniform expansion.
As an example, the differential of allowable movement in the North Pacific Plate took much more plate width to achieve the gradual domination and curving of the ridge, while more importantly the opposing plate (Farallon) was being simultaneously reduced by subduction. Even though the South Atlantic MOR offset looks to be uneven it is in actuality very close considering it has been constructing sea floor for maybe 150 - 200 million years. So the Atlantic will be rather limited in this behavior compared to the Pacific until one side or the other of the Atlantic's oceanic crusts separate from its adjacent continent. When that occurs the oceanic plate still connected to a continent will have the most differential of allowable movement and gain the most infill on its side of the ridge axis. By the time this section eventually fractures and separates its counterpart will have been in subduction long enough that it cannot regain any advantage again, as the Pacific currently displays.
6.5 Why does the ridge have a 250 and 215 km offset? I suspect the offset in this and other ridge segments, including those that are nearly equal in latitudinal balance is due to the gradual increases and decreases that the mantle has sustained in its history of expansion and contraction cycles. The 215 km offset represents the total accumulation of ridge infill in proportion to that specific plate section's distance to its continental attachment point. The individual infills showing the magnetic field generator's specific heat flux and the resultant mantle circumference in comparison to past lower and probable higher thermal periods.
This is how the crust accommodates the ebb and flow of the thermal cycles where both oceanic and continental crust is radially extended and the sea floor is slightly raised from below by the mantle and the magma that is injected into the gradually opening mid-ocean ridge.
The lack of stress relieving mechanisms like convergent boundaries in the Atlantic oceanic plate sections requires them to accommodate the much greater compressive energies that are supplied by the adjacent continent's mass' as the mantle periodically and incrementally moves inward. These stresses will be greatly reduced when the oceanic plates eventually separate and can then process these gravitational potential energies into their own adjacent trenches.
6.6 The energy that the expansion has placed in the crust as raised mass will be slowly released as compression during contraction periods where energies would vary all along the MOR due to variations in ridge infill. At the time when the ancient continent fractured creating the Atlantic Ocean and Mid-Ocean Ridge the fracture offsets were probably non-existent, similar to area C in image 4. The expansion that followed was most likely caused from a large increase of core temperature. The planet had probably been in a long period of lower core energy and the sudden thermal increase is what initially broke the crust and restarted the gradual expansion of the mantle that was periodically interrupted by contraction episodes. These two directional movements of the ridge require latitudinal fractures to facilitate the increases and decreases in circumferences. As time passes the fractures will lengthen, smaller fractures may become dormant and fill with sediment giving over to larger and wider spaced fractures like those of the North Pacific's Mendocino south to the Marquesas. All of which are much wider spaced and longer in length.
Now we can see where a periodic pulse of hydraulic magma to overcome the almost unimaginable shear resistance/adhesion is really a possibility. When the Atlantic ridge opens during thermal expansion its allowable movement involves not just a 10 km thick oceanic crust like the Pacific but four massive continents, their rigid mass locking in that serpentine axis and preventing uneven movement. You can easily see why the North Atlantic only expanse 25 mm a year compared to the Pacific’s expansion of 80-120 mm a year. The weight of the North American and Eurasian plates is limiting the allowable movement by their massive weight and tremendous shear resistance and adhesion. Most of the movement is in the lighter ocean plates and is proportionate to their distance to the continents which is proportionally less than the Pacific. The Atlantic started with almost no allowable movement, so each infill was incrementally larger over time with the ocean plate having slightly more movement with each cycle than the last.
6.7 As time goes by the gravitational potential energy in the vertical movement will increasingly become stored in the oceanic crustal mass as potential lateral compressive energy to be released during the thermal contraction portion of the cycle, most of it in the heavier continents that will then be transferred to the oceanic plates. This is in contrast to the expansion period when the oceanic plate plays the central role through its degree of differential allowable movement, initiated by the outward displacement of the mantle, that accommodates more movement than the continents because the mantle will move in the direction of least resistance, slightly lifting the ocean plate in addition to the radial expansion that engages all the crustal plates. The compressive load energy over time will cause compaction of the oceanic plate material, this is what is responsible for the thickening of the oceanic plates and making them more rigid and stronger.
There was a time in the past when the East Pacific Rise had most of its eastern oceanic plate (Farallon) and with the Pacific Plate had a combined ridge expansion somewhere near the present combined total of the Atlantic and Pacific. As the Atlantic incrementally increased in allowable movement and potential compressive energy the Farallon decreased in same. And the Pacific having the wider longitudinal distance to the adjacent continent gained the most infill and off set its ridge to the Farallon side.
There are probably several reasons the Farallon was lost first and the Pacific will survive a bit longer; one is the East Pacific Ridge was closer to Eurasia on the Farallon side of the ridge. And also, this section was probably the first to separate from its adjoining continent which allowed the Pacific side to establish a dominate lead. But, most importantly, the Eurasian continent not only outweighs the North American continent but it is buttressed by the Pacific plate that is subducting against the Eurasian continental margin. Against all of this the N. A. continent is much easier to move. I think a hydraulic magma is needed to facilitate not only the thermal expansion movement of such mass, but also the overriding of the Pacific plate by the North American and Eurasian continental plates.
6.8 The Pacific plate was once connected to the Eurasian continental plate until shear derived tension of the ever growing oceanic plate overcame the structural integrity of the western end near where the continental plate is now overriding the oceanic plate's western edge. The outward expansion of the mantle created tension on the oceanic plate, as the mantle displaced outward it applied a broad shear force to the underside of the oceanic plate, causing the plate to break off and thus allow the continental connected section of seafloor to rise in counter action to the weight of the main section of the Eurasian plate. The two formerly joined sections could then function as a divergent plate boundary for the remainder of the expansion cycle. Millions of years later when the thermal cycle changed back to cooling and compression the fractured oceanic plate edge began its new role as a subducting plate that will produce in the following thermal expansion periods many ever growing trenches and island arc chains with their accompanying back arcs.
7.0 When the supercontinent Pangaea started to break up 170 - 200 million years ago there was probably a convergent plate boundary on both east and west continental shelves with the current Pacific divergent plate boundary occupying a position somewhere on the opposite side of the Earth. This arrangement had maintained a balance until the expansive land mass succumbed to the constant cycles of thermal expansion and contraction which broke the massive continent into the smaller land masses we recognize today. The event may have been instigated by a period of higher solar magnetic induction that produced a multitude of higher thermal cycles in the mantle and crust. When the North American and African tectonic plates parted, the separation of the plates created a basin that became the Atlantic Ocean and opened up fissures in the Earth's crust triggering volcanic eruptions that lasted for 600,000 years. The outflows of lava covered more than 9 million square kilometers (3.5 million square miles), an area roughly equal to the continental United States. Scientists call this area the Central Atlantic Magmatic Province (CAMP).
The 200 million year journey of the new world continents has produced the broad sea floor of the Atlantic Ocean and through the mechanical leverage of gravitational energy acting on continuous deposits of ridge material has propelled the divergent land masses over the Pacific plates now shrinking convergent boundaries. As the Atlantic widens, tension during thermal expansion will gradually increase until the long extended ocean crust has enough frictional drag from shear forces to cause the ocean crust near the east coast of the America’s to fracture. This fracture will become a new convergent plate boundary with the continent overriding the ocean crust. At that moment the new "West" Atlantic plate will no longer be pushing the heavy North American plate and it will unload its preloaded gravitationally supplied movement into the new convergent zone. If the continental crust is too massive and the thermal expansion is possibly of a higher degree the repeated thermal cycles could break and extend the land mass at its weakest point. If a large thick continental crust was repeatedly flexed as shear forces were applied from below, the continent would then succumbed and separated during the following continuous thermal expansion/contraction cycles.
-----------------------------------------------------------------------------------------------------------------
Page 20
A model for
Continental breakup
------------------------------------------------------------------------------------------------------------------------------------------------------------------------------------------------------------------
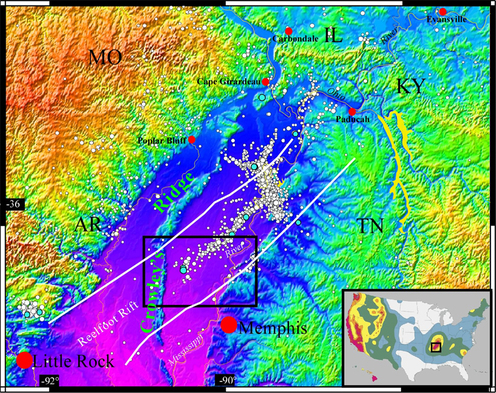
7.1 This may also be what is causing stresses and seismic activity in the New Madrid Seismic Zone (NMSZ) in the Mississippi river region. There is not a stress relieving convergent or divergent boundary zone off the continental land mass where the Atlantic Oceanic crust may fracture millions of years from now, so there’s more demand on the allowable movement aspect of the mechanism.
Left; Map of middle Mississippi River valley in the central U.S. showing topography (purple at about 47 m up to orange at about 360 m elevation). White heavy lines bound the Reelfoot rift. New Madrid seismic zone seismicity shown by white and blue circles, are evidence that earthquakes threaten the Mississippi, Ohio, and Wabash River valleys of the Central United States. Several of the largest historical earthquakes to strike the continental United States occurred in the winter of 1811–1812 along the New Madrid seismic zone, which stretches from just west of Memphis, Tenn., into southern Illinois. Black box outlines Transect study area. (Base topographic map courtesy of Robert Smalley, Univ. of Memphis.)
Image left and below courtesy of USGS
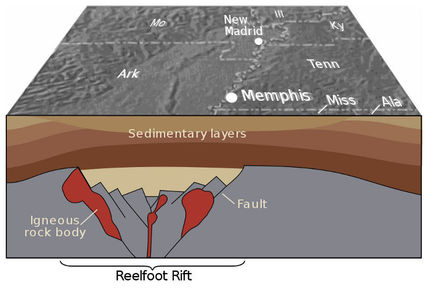
http://neic.usgs.gov/neis/eq_depot/2003/eq_030606/
The earthquakes of the New Madrid seismic zone occur within a large network of faults called the Reelfoot rift. The rift formed about 500 million years ago, when this region was stretched in the northwest-southeast direction. Along a northeast-southwest zone at least 70 km (40 mi) wide and 500 km (300 mi) long, the rocks in the rift were slowly dropped down about 1-2 km (1 mi) along some of the faults. Now the region is undergoing east- west shortening, and the ancient faults of the Reelfoot rift are being reactivated to generate earthquakes.
7.2 “This region was stretched” as if the displacing mantle was applying shear forces to the regions underside. This sounds like tension fracturing of the upper surface area rock from the crust being put under tension from shear forces derived by the mantle's expansion.
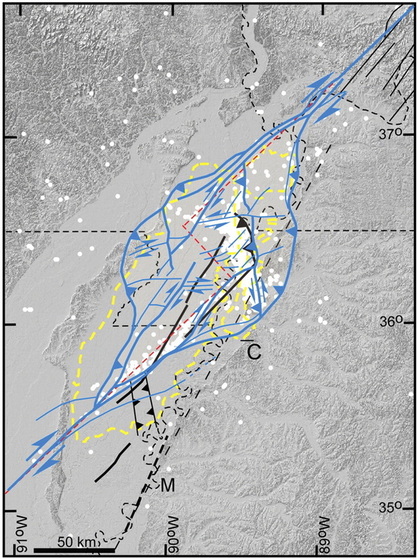
http://www.uc.edu/news/NR.aspx?id=13782
Attila Kilinc, professor of geochemistry explains that the New Madrid fault zone is not a single crack threading through the central U.S. – but that tens and sometimes hundreds of fault lines are running parallel to each other for about 125 miles from Arkansas to Illinois. Because these faults are not exposed at the surface, it’s very difficult to make measurements of movement, and it’s difficult to forecast on which fault the next earthquake might nucleate.
7.3 These fractures would have backfilled immediately with debris and been additionally fractured and disconnected from their base during the contraction cycle. These blocks will continue to loosen and fall in subsequent expansion-contraction cycles. This process would work the loosened crust and fill material continually down into the developing primary plate fractures, lowering the valley floor. The belief that it is now “undergoing east-west shortening” could be the expansion cycle is only in play in this fault zone during high thermal periods, loading up the debris and setting up the fault for series compressive slips over a period of hundreds or even tens of thousands of years. The 1811-1812 events were compressive slip events of the debris. Gravity acting on the raised plate is compressing the debris in the fault, driving the process of periodic movement of debris in the fault as the shear forces under the plate do not yet have the energy to tear the continent in half .
Image above courtesy USGS
7.4 As the continentally connected section of seafloor slowly lengthens the stresses applied to this fault will increase in proportion. Will the oceanic plate fracture in time to save the continent? Time will tell.
7.4 As the continentally connected section of seafloor slowly lengthens the stresses applied to this fault will increase in proportion. Will the oceanic plate fracture in time to save the continent? Time will tell.
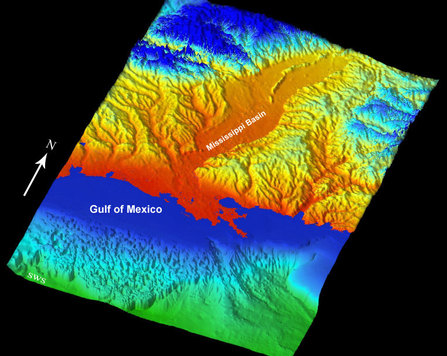
http://phys.org/news156169464.html
A team from Purdue and Northwestern universities analyzed the fault motion for eight years using global positioning system measurements and found that the fault system is moving at a rate of less than 0.2 millimeters per year and there is likely no motion.
Image left courtesy USGS
A team from Purdue and Northwestern universities analyzed the fault motion for eight years using global positioning system measurements and found that the fault system is moving at a rate of less than 0.2 millimeters per year and there is likely no motion.
Image left courtesy USGS
-----------------------------------------------------------------------------------------------------------------
Page 21
A model for the
Dynamic operation of the
Core-mantle thermal expansion mechanism
-----------------------------------------------------------------------------------------------------------------------------------------------------------------------------------------------------------------
7.9 The current standard model for plate tectonics has many unanswered technical inconsistencies that I believe this model can answer. We have already seen how well the thermal cycle fits the basic requirements of the observations, but how does it fit the deep interior of the Earth?
It is basically the same as the current standard model with the crust and upper portion of the mantle forming the cooler and more rigid outer layer of the Earth, aka the lithosphere. The asthenosphere is supporting this movable load and is substantially hotter and denser. So far no difference. In both models the crust and upper mantle are capable of the thermal transfer of heat through conduction. The lower mantle is considered thermodynamically more isolated. It is however ideally suited to the transfer of energy in the form of strain energy from its forced displacement outward, able to deform in radius repeatedly for hundreds of millions of years without expressing substantial structural change or weakness. It is analogous to the simple toy ball we had when we were kids, the Super Ball. If one had a ball with the mantle's scaled down dimensions and possessing a center of thermally, or for experimentation, hydraulically expandable material to simulate the outer cores thermal expansion, a simulated cycle could be observed.
The thickness of the mantle is instrumental to the mechanical leverage that the mantle's displacement imposes on the crust. It can multiply the very small but almost infinitely powerful expansionary energy that exists at the molecular scale during the thermal expansion of the outer core's molten iron, and convert it into much larger lateral kinetic movement that manifests in the crust at the surface. It is analogous to the mechanical advantage attained through the gear ratios of mechanical energy transfer systems.
8.0 The current standard model has over the years been modified as the inconsistencies became apparent. One is the speed of the convective material rising up through the mantle is at timescales of tens of millions to hundreds of millions of years. It is slow in the transport of heat content that is required at the lithosphere to produce thermal and kinetic evidence of either convection cells or mantle plumes.
The various surface phenomena have specific identifiable time periods, the Hawaiian Island - Emperor Seamount Chain and flood basalt eruptions like the Deccan Traps and Siberian Traps for example, have periodicities that challenge a mantle plumes ability to maintain a simple causational link to timing and volume.
8.1 In this model the conductive energy transfer in the mantle is still occurring but the thermal expansion in the core produces an instantaneous mechanical transfer of strain energy to the mantle's outer boundary. The mantle is uniquely suited to this process, its density is the product of gravity acting on its mass weight of 4,080,000,000,000,000,000,000 tons in combination with the heat of the field generator that has an estimated temperature at the outer core-mantle boundary of 4400 C (7952 F). The electromagnetic processes of the core's thermal expansion/contraction and the compressive energy of gravity has in the last 4.5 billion years given the mantle a high coefficient of restitution. The untold number of expansion cycles has increased the density and arranged the composition of the materials in a manner similar to the same processes used to make highly resilient materials, that being extreme high pressure and temperatures. This has given the mantle the properties to resist additional compression, requiring the lower mantle to telegraph toward the surface additional expansive/contractive strain energy movement imposed by the thermal expansion/contraction of the outer cores 4400 C liquid iron as the solar magnetic field's variability forces temperature flux.
8.2 Excerpts below were furnished through and by no way endorsed by Allan F. Bower
http://solidmechanic.../Chapter4_3.htm
Applied Mechanics of solids by Allan F. Bower
Solutions to simple boundary and initial value problems
4.3 Spherically symmetric solution to quasi-static large strain elasticity problems
4.3.1 Summary of governing equations of finite elasticity in Cartesian components
This section is intended to illustrate the nature of solutions to elasticity problems with large shape changes.
4.3.2 Simplified equations for incompressible spherically symmetric solids

8.3 Please refer to Dr. Bower's http://solidmechanics.org/text/Chapter4_3/Chapter4_3.htm to completely appreciate his understanding of the mechanical dynamics involved.
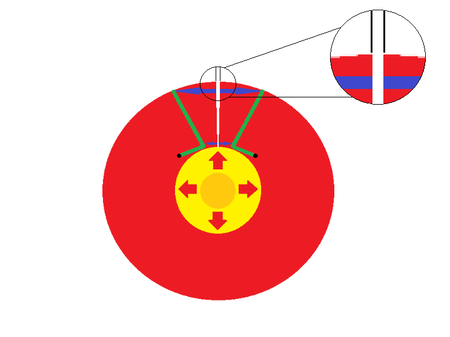
8.3.1 This type of energy transfer mechanism is known as strain energy. In the image left, the very subtle mantle displacement idea would produce what is already commonly observed. That in any example of a thick-walled deformable sphere that is displaced outward from within, the uneven rate of expansion between the widely spaced interior and exterior surfaces produces tremendous increase of strain energy differentials that are manifested as lateral increases on the sphere’s outer surface area. In other words; a very small displacement of the inside boundary would result in an increase to the outside boundary based on the proportional difference of the two surface areas, or more easily considered, the substantial thickness of the mantle that lies between them and behaves as a mechanical increase device.

8.3.2 The molten liquid iron of the outer core should require a very small amplitudinal change in intensity to initiate the needed thermal expansion. The mantle's thickness will provide the mechanical advantage to multiply the very small thermal expansion at the core into the larger mantle surface displacement at the crust/mantle boundary.
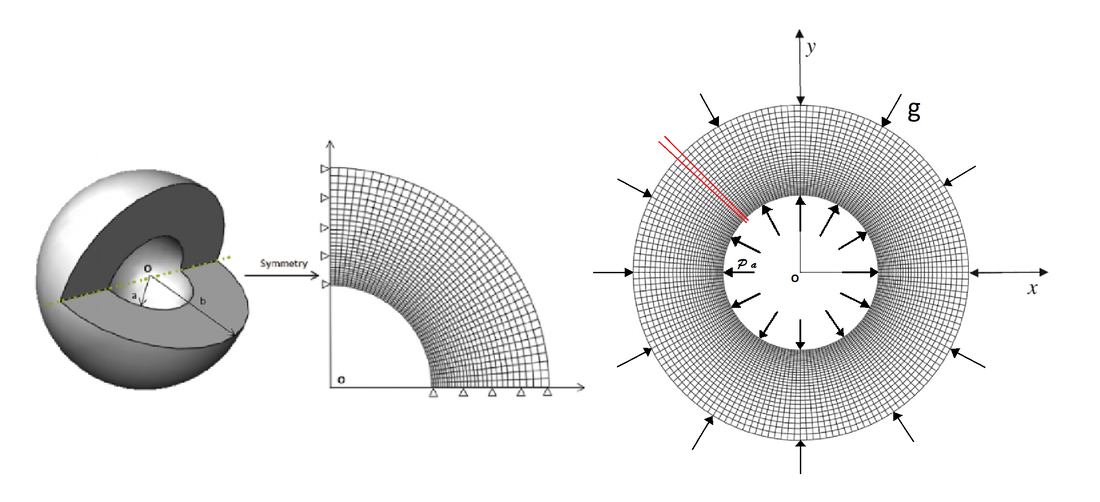
8.3.3 If we could imagine for a moment that the Earth's crust had been made transparent. And that the highly viscous mantle was now observable during one of those mantle thermal pulse periods described by Bonatti et al., one when the planetary field generating components were thermally expanding and displacing the mantle outward. We could then observe the mantle's structurally weaker outer surface areas being subjected to the strain energy differential forces that would easily locate the many mantle surface areas of lower viscosities, the ones that still had residual weakness' and higher temperatures from previous mantle thermal pulse periods of the past.
8.3.4 These weaker mantle surface areas would begin to melt as they began to release the strain energy under the building tension. And as these fractures widened, they proportionally lengthened and also deepened, continuing the tearing and melting as the sudden release of tension allowed the mantle material to melt without regard to their depth under the crust and the pressures that theoretically would under normal conditions prevent such areas of the mantle from melting.
8.3.4 These weaker mantle surface areas would begin to melt as they began to release the strain energy under the building tension. And as these fractures widened, they proportionally lengthened and also deepened, continuing the tearing and melting as the sudden release of tension allowed the mantle material to melt without regard to their depth under the crust and the pressures that theoretically would under normal conditions prevent such areas of the mantle from melting.

8.3.5 In the image at right; When the tectonic plate's volcanically active boarders are placed onto the proxy mantle,
the model's simple concept is easy to comprehend. As the mantle displaces the tectonic plates, the mantle will immediately melt and expand (extrude) into the low pressure zone of the widening gap.
Eventually, some of these mantle tears, with their periodic and residual thermal content, will be located beneath weaker areas of the overriding crust as it is moved tectonically around the globe.
And periodically, some of these larger tears will align with the sutured areas at the margins between two tectonic plates, leading to the process of volcanic eruptions and discharges that precede the breaking up of a super continent similar to what is occurring at the Great African Rift Zone at this time. These larger thermal eruptions will eventually produce a nascent ocean basin.
8.3.6 These mantle tears may manifest as hot spot eruptive phenomena like an island chain or a Yellowstone volcanic zone. A larger tear could preheat the crust for several cycles and incrementally extend the overlying crustal area during the subsequent thermal pulse periods. These substantial mantle tears would be slowly reopening, and imposing their divergent dynamics into the overriding crust in such a manner, as is currently happening within the Basin and Range Area in the S.W. United States.
And of coarse, if a massive solar magnetic period occurs, there could be a Large Igneous Province discharge event as the voluminous amount of melted mantle material will force its way out into the lower pressure zone between the diverging crustal plates.
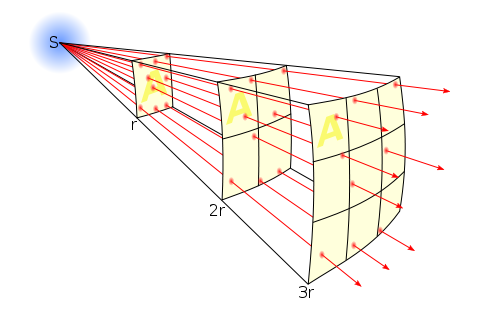
8.3.7 When the inverse square law is used to illustrate the outward displacement of the mantle the extreme surface tension at the crust/mantle boundary is easily understood. The resulting strain energy displacement would produce decompression melting of the surrounding boundary surface area materials, creating the hydraulic magma to displace the crust and fill the divergent plate boundaries.
Image above provided by Borb who has no connection to this author or this paper and was provided through Wikipedia Creative Commons.
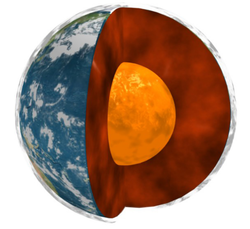
8.4 This description of the dynamic operation of the core-mantle thermal expansion mechanism shows a simple method of operation. Needing little more than gravity and the mass of the planetary components to produce, what are small by planetary scales, the outward strain energy movement that slightly extends the crust on a layer of hydraulic magma while slowly opening the divergent plate boundaries to the inflow, or more accurately the intrusion of magma into the mid-ocean ridge.
The outer core's thermal expansion that produces the strain energy, can press out the mantle faster than the outside radius of the mantle, due to its high viscosity, can expand in response. This causes tremendous tensile forces on the super viscose surface. These forces cause breaks or more like tears over the transitional boundary surface area of the mantle. This expansion driven tension release causes a reduction of pressure, allowing instantaneous melting of torn mantle surface and boundary area material. "Instantaneous" in this case is in scale to the phenomena, the surface area tearing would appear to us as ultra slow motion, comparable to the mid-ocean ridge spreading rates, as the large and small fractures are slowly pulled apart like cold taffy. A hydraulic magma is produced in these larger deeper tears when the mantle's viscosity initially resisted the internal strain forces tearing the mantle surface open to create these globally connected mantle fractures that underlie the current divergent boundary system.
Image courtesy of USGS
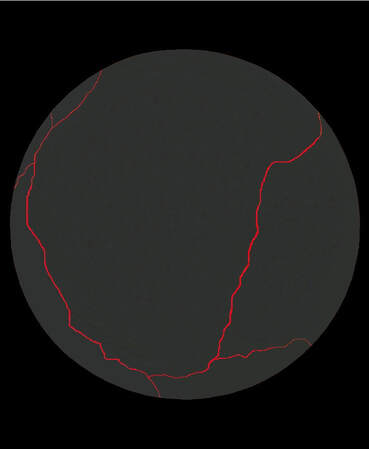
8.4.1 If we could imagine the Earth having a transparent crust so as to observe the mantle in its natural state, we might wonder in more critical temperament how all of the hypothesized convective cells in the mantle could produce the observed movement in the divergent boundaries of the crust.
8.5
http://dx.doi.org/10...099.2013.835283
Australian Journal of Earth Sciences: An International Geoscience Journal of the Geological Society of Australia
Volume 60, Issue 6-7, 2013
D. L. Anderson
"Seismology, thermodynamics and classical physics—the physics associated with the names of Fourier, Debye, Born, Gr€uneisen, Kelvin, Rayleigh, Rutherford, Ramberg and Birch—show that ambient shallow mantle under large long-lived plates is hundreds of degrees hotter than in the passive upwellings that fuel the global spreading ridge system, that potential temperatures in mantle below about 200 km generally decrease with depth and that deep mantle low shear wave-speed features are broad, sluggish and dome-like rather than narrow and mantle-plume-like. The surface boundary layer of the mantle is more voluminous and potentially hotter than regions usually considered as sources for intraplate volcanoes."
This would suggest there is evidence that the crust/mantle boundary contains large volumes of magma that would be at play in providing a hydraulic medium between the mantle and crust, extending the crust while simultaneously extruding into the divergent boundaries as is currently being observed. The model proposes the magma is dependent on the strain energy that is simultaneously released by the mantle during its displacement.
"that potential temperatures in mantle below about 200 km generally decrease with depth"
That observation runs counter to the the standard model and the generally accepted belief that temperatures are lower nearer to the surface and increase with depth. A source and its accompanying mechanisms would be needed to explain this crust-mantle boundary temperature anomaly.
8.6 Referring back to that paper regarding the mantle's oscillations;
https://www.academia.edu/38174615/Mantle_thermal_pulses_below_the_Mid_Atlantic_Ridge_and_temporal_variations_in_the_formation_of_oceanic_lithosphere
Mantle thermal pulses below the Mid-Atlantic Ridge and temporal variations in the formation of oceanic lithosphere
Enrico Bonatti*†‡, Marco Ligi*, Daniele Brunelli*†, Anna Cipriani‡, Paola Fabretti*, Valentina Ferrante*†, Luca Gasperini* & Luisa Ottolini§
* Istituto di Scienze Marine, Geologia Marina, CNR, Via Gobetti 101, 40129, Bologna, Italy
† Dipartimento di Scienze della Terra, Universita` “La Sapienza”, Piazzale Aldo Moro 5, 00187, Rome, Italy
‡ Department of Earth and Environmental Sciences, Lamont Doherty Earth Observatory, Columbia University, Palisades, New York 10964, USA
§ Istituto di Geoscienze e Georisorse, Sezione di Pavia, CNR, Via Ferrata 1, 27100, Pavia, Italy
"We calibrated our spinel and opx Cr# data in terms of degrees of melting assuming as a source a fertile, pyrolite-like peridotite13,15. Degrees of melting
calculated from Ti/Zr of cpx and from Cr# of opx and spinel correlate. They range along the VLS from 5.7% to 14.3%, with oscillations where the degree of melting appears to increase gradually and then decreases rapidly. These short-wavelength oscillations are superimposed on a long-term (.15Myr) trend of increasing degree of melting with time, estimated on a regression line to range from 7 ^ 1.5% about 19Myr ago, to 13 ^ 2% about 4Myr ago."
8.7 You can see in that description above the strain energy response of the mantle's outer surface to the core's outward displacement. As the viscosity resisted the mantle's surface tension, the outward expansion caused the mantle's surface to be shredded and torn and thus melted. Then when the outer core's thermal expansion eventually paused the mantle's "melting" did also as the temperature "decreased rapidly." Eventually the Earth's magnetic field strength increased further still and supplied another pulse of strain energy, and through that, the further melting of the crust/mantle boundary during another period of slowly increasing mantle melting followed by another rapid decrease as the strain energy waned once more.
The timing of these oscillations fit the surface observations remarkably well.
8.8 The Yellowstone Hotspot’s intermittent progress eastward across the N.W. U.S. displays the pause that allows the caldera to form. This stationary period coincides to when the mantle is incrementally displacing outward as magma is filling the slowly opening divergent boundaries around the world. This new ridge material will in turn provide the leverage to produce the westward advancement of the N. American plate that simulates the Yellowstone hotspot’s movement east during the mantle’s subsequent return towards the core.
The timing matches the paper's estimates;
"The degree of melting of the mantle that is upwelling below the ridge, estimated from the chemistry of the exposed mantle rocks, as well as crustal thickness inferred from gravity measurements, show oscillations of ,3–4 Myr superimposed on a longer-term steady increase with time. The time lag between oscillations of mantle melting and crustal thickness indicates that the solid mantle is upwelling at an average rate of ,25mmyr"
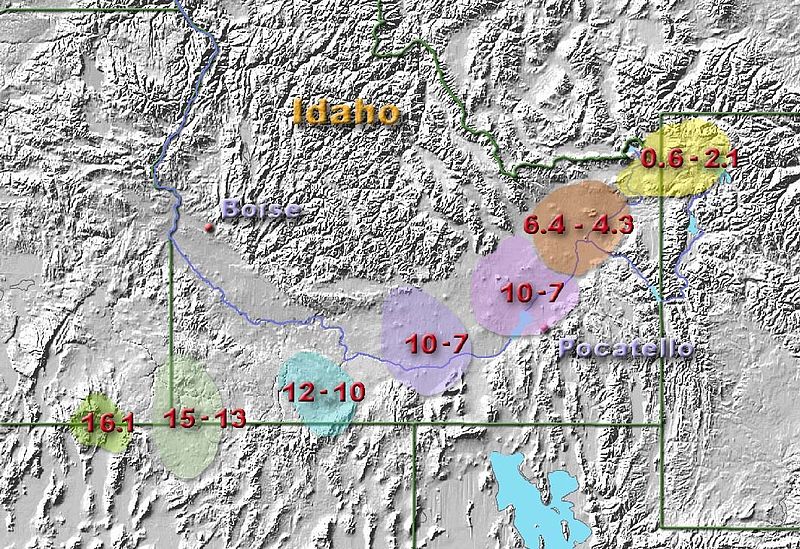
Image provided by Kelvin Case at English Wikipedia, who has no connection to this author or this work.
8.9 As you can see the fit is remarkable, this model matches not only the overall timing but the duration of the cycle segments of pause and then movement to the next hot spot location. Add to this the model's ability to furnish the energy to move the continental mass over the remains of the Farallon and the hot spot complex itself, makes this a very accurate prediction of observation.
8.9 As you can see the fit is remarkable, this model matches not only the overall timing but the duration of the cycle segments of pause and then movement to the next hot spot location. Add to this the model's ability to furnish the energy to move the continental mass over the remains of the Farallon and the hot spot complex itself, makes this a very accurate prediction of observation.
Image above courtesy of USGS
8.9.1 The current explanation for the Hawaiian-Emperor Seamount Chain is that they are the result of a hot mantle plume from the core/mantle boundary or are the result of a lithospheric extension that allows the passive rising of melt from a more shallow depth.
The continuous plate movement of the standard model puts the responsibility of this island chain's periodicity of individual island building while progressing laterally on a continually moving ocean plate squarely on the magma source and the requirement that it must have the unique ability to produce the magma in pulses so as to build islands separated by time and distance. The fact that the standard model does not offer a satisfactory means to move the plates in the first place only compounds the model’s problems regarding this phenomenon.
The asthenosphere's visco-elastic material is at depths between 100 and 200 km (62 and 124 miles) below the surface, but perhaps extending as deep as 700 km (430 mi). The thickness, high viscosity and pressure of the asthenosphere are key to the mechanics of this mechanism. The asthenosphere’s viscosity is that of a rocky material under extreme pressure and temperature with movement, that according to the current standard model, is of a convective nature that operates in time scales of tens of millions to hundreds of millions of years. This ultra-slow rotational movement of mantle material known as convection cells is one of the mechanisms that the current standard model proposes as the source of tectonic plate movement. Because research from 3D seismic tomography images of the mantle's internal structure has not produced evidence of this process in the years since its proposal, some in the field have made additional modifications to the theory.
8.9.2 Mantle Plume Theory was suggested shortly after plate tectonics acceptance to accommodate the phenomenon of the Hawaiian Island - Emperor Seamount Chain. It was further developed in the 1990's to maintain convection as the central energy source for massive scale plate movement, explaining that the dividing of continents such as North America and Europe, required large scale plumes to rise from greater depths, possibly the outer core, with smaller plumes explaining smaller phenomenon. As inconsistencies developed modifications were proposed that include; mantle wind, Euler pole jerks, mantle roll, magma tunnels, hidden plate boundaries, lithosphere drift, super plumes, lateral flow, group motions of "hot spots", plume head decapitation.
https://www.earthmagazine.org/article/question-mantle-plumes
“These methods reveal the seismic structure of the mantle,” says Gillian Foulger, a geophysicist at Durham University in England, and a longtime collaborator of Anderson’s. They “do not reveal the geological structure. The two are not the same.”. . . . .
. . . “Plumes have been proposed to come from almost any depth, to rise vertically or tilt, to flow for long distances laterally, to have narrow or broad conduits, to have no plume head, one head, or multiple heads, to produce steady or variable flow, to be long- or short-lived, to speed up or slow down, to have a source that is either depleted, enriched, or both, and to have either high or low [ratios of helium-3 to helium-4],” Foulger wrote in Geoscientist in May 2003.
She wasn’t alone in her thinking that the hypothesis was becoming too broad. In a letter to the editor of Geoscientist that year, Northwestern University seismologist Seth Stein wrote: “I wouldn’t blame anyone for the state of thinking … about hot spots and mantle plumes except ourselves. As in Pogo’s dictum, ‘We have met the enemy and they are us.'”
Stein added that in the “absence of any other clear model,” the geoscience community had accepted “very vague ideas about plumes” and allowed them to become the “null hypothesis” for anomalous volcanism. He noted that although the hypothesis initially entailed rigorous criteria — for example, the presence of a low-velocity zone, age-progressive island chains and near-fixity — the science had progressed to the point where “plumes don’t have to meet any particular test.”
“Hence the hypothesis now always works with appropriate site-specific modifications, but increasingly doesn’t tell us anything or predict anything, especially about structures formed in the past,” he wrote. “It does, however, make it harder to offer nonplume explanations.”
9.0 The Plume model appears to be a rather incomplete and complicated explanation that requires a tenuous expectation of the source’s ability to maintain such consistency over what likely extends beyond the farthest currently observed position of this system, considering the oldest seamount dates to where the chain is now being consumed into the Kuril–Kamchatka Trench 5,800 kilometers from the source’s current location suggests it could be much older still.
------------------------------------------------------------------------------------------------------------------------------------------------------------------------------------------------------------------
Page 22
Model of
Hawaiian-Emperor Seamount Chain
-----------------------------------------------------------------------------------------------------------------------------------------------------------------------------------------------------------------
9.1 I have looked for the “tree rings” of the magnetic field generator’s thermal cycle, a solid readable record of the mantle thermal cycles of the planet, the Yellowstone is a very convincing example and I think I found another. I think the Hawaiian Island chain and its undersea ancestors of the Emperor Seamount Chain are the record I’m looking for. Let’s take a look at the evidence.
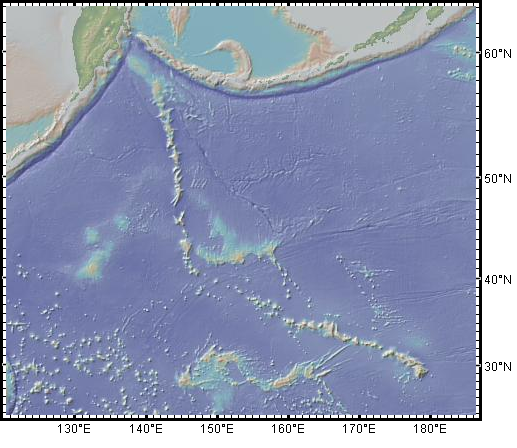
9.12 The current standard model infers the ocean crust is in constant motion and that the mantle plumes or lithospheric extensions of magma are responsible for the periodicity and volume of each island building event.
9.13 According to this model the reason the islands are separated and fairly individual is that the islands are built during the outward displacement portion of the cycle. The Mid-Ocean Ridges are receiving their new infill of magma, and the tectonic plates are slowly moving past over the top of the Hotspot as their fossil gravitational potential is providing the energy to drive them towards the convergent boundaries. Below them the hydraulic magma is being forced out through the newly cracked opening in the oceanic crust that now lies directly over the expanding and melting mantle tear.
Image above was acquired from GeoMapApp at http://www.geomapapp.org using Ryan, W. B. F., et al. (2009), Global Multi-Resolution Topography synthesis, Geochem. Geophys. Geosyst., 10, Q03014, doi:10.1029/2008GC002332.
9.14 The seamounts and the hotspots that make them are a thermal expansion dependent mechanism, or more specifically, what is simply a large deep tear in the mantle's surface from past historic crust/mantle boundary hyperthermal events. To illustrate this idea, we need to imagine how the mantle would respond to a outward force from within as the core's magnetic field generating components thermally expanded, and further how the mantle would respond in kind as its entire outer surface is being subjected to immense multi vector lateral tensions. We would see that these higher tractions would manifest in locations on the mantle's surface far away from continents and their adjacent boundaries where higher mantle thermal process' already manifest as subduction and volcanic phenomena.
9.14.1 The broad expanse of a cooler mantle surface located centrally under a broad ocean basin like that of the Pacific's would be the most vulnerable to such deformations. And as would be expected, the resultant, and increasing, strain energy would eventually locate the many weakness' that exist anywhere on the mantle's highly viscous surface that could not resist the immense strain tensions applied to them. The center of these ocean basins may be the incubator for these long lasting residual thermal mechanisms that may eventually be overran by a continent and produce phenomena like the Yellowstone complex and Basin and Range like extensional environs. Undoubtedly, the cooler mantle's surface under the Pacific's would not stretch in the familiar somewhat even manner like a thin balloon would. Its hot, dense and viscous rock would instead mostly resist the surface tension until a weakness is exposed and suddenly torn. This sudden rapid release of the immense tension of the affected areas produces the sudden lower pressures that allows the surrounding materials to melt.
9.15 These phenomena would occur all over the mantle's outer surface, in a wide range of sizes, with some large enough to be what we would observe to be as a hotspot, like the one we now observe under the Hawaiian Islands. These would ideally be what would weaken the crust above it and exploit the divergent lateral forces produced by the mantle thermal cycles to create a nascent triple junction and begin the divergent boundary process where none had been prior. This would of course follow the processes laid out here already where the thermal cycle would subside and the divergent boundary would compress the recent infill to produce compression in the crust. While back at the island chain, once again, the Hotspot/Mantle-tear would reform into the now cooler thermal plastic mantle rock, and remain as such, until the next solar magnetic increase that begins the process' that would again exploit and reactivate that still thermally weakened region, initiating localized strain energy once more and producing again the passive melt that propagates through the weakened crust to begin another nascent island.
9.16 This Hotspot/Mantle-tear would stay located in the mantle where its residual thermal footprint was born, even though the oceanic plate anomaly above is moving on with the migrating plate, but we could imagine the mantle having uneven directional surface tractions from various other directions that would pull on the tear more from one direction than another during the following cycles and would thus over time experience increased tractions from both the crust and mantle from one particular direction than the others, leading to the Hotspot/Mantle-tear migration overtime. The Hotspot/Mantle-tear began and would of coarse continue to produce the molten magma during each following mantle thermal cycles.
9.17 So, we've gone from an obscure point on the mantle underneath the middle of an oceanic plate, to where simple mantle dynamics leads us to how a chain of island/seamounts are established and simple surface tension variation dynamics on the mantle can tug a Hotspot/Mantle-tear in an appreciable direction and distance over time. And, if these energies were to ever rise to the appropriate levels, this island building thermal anomaly could become a much larger expression of divergent forces and weaken the overriding crust enough to produce a triple junction that may someday develop into a divergent boundary.
In the following research paper we can see this exact scenario described;
http://www.mantleplumes.org/Hawaii2.html
Speculations on tectonic origin of the Hawaii hotspot
Ian O. Norton
ExxonMobil Upstream Research, Houston, Texas, USA
9.18 "Figures step though time showing areas of sea floor appearing as they are created" . . . . "with the area north and west of the trench blanked out. This is done to emphasize that the sea floor we are dealing with was a long way from any continental margin when it formed"
"Anomalous topographic features in the area were created in several ways: Shatsky Rise by excess ridge axis-type volcanism at a triple junction (Sager et al., 1999; Mahoney et al., 2005); Hess Rise by excess volcanism at a ridge-transform intersection perhaps associated with a spreading direction change (Figure 6); Chinook Trough by ridge reorganization also associated with a spreading direction change (Figure 9); Emperor Trough as a fracture zone (Figure 8) and Meiji Seamount at a spreading ridge associated with both a spreading direction change and perhaps at the ridge left behind by a ridge jump"
"Geochemical evidence presented by Keller et al. (2000), particularly strontium, lead and neodymium ratios, are also consistent with formation of Meiji and Detroit seamounts close to a ridge axis. I suggest here that Meiji formed at the Pacific – Kula/Izanagi ridge axis as a result of excess volcanism associated with the 30° change in spreading direction from 84 to 71 Ma shown in Figures 9 and 10. As inferred in Figure 10, Meiji may actually have formed at an abandoned spreading center left behind as north-directed spreading became established."
"Meiji is the oldest preserved seamount in the Hawaii-Emperor seamount chain. Whether there were older seamounts in the chain that have been subducted is, of course, not known. However, if the inference from gravity data, isotopic data and the plate boundary scenario presented above that Meiji formed at a ridge axis is correct, it is likely that Meiji is the oldest seamount in the chain. If this is so, and it formed by processes related to sea floor spreading, an important implication is that the Hawaii hotspot also formed by processes initiated at the (abandoned?) spreading ridge. This means that the hotspot formed as a result of spreading processes and plate tectonic motion. It would, of necessity, have a shallow (upper mantle) origin. This is different to the usual model for a hotspot as being derived from the mantle or core remote from the influences of plate tectonic processes and thus superimposed on plate processes, with little interaction between the two. The shallow model is along the lines of the "plate model" for the Earth proposed by Anderson (2005) and the "alternative Earth" of Hamilton (2003)."
As you can see by the descriptions above, this model's straight forward and simple idea is a best fit over any other current model.
9.19 These phenomena are pressurized with hydraulic magma from the crust/mantle boundary area during the thermal expansion of the mantle and are slightly raised causing the crust to be stretched and thinned, eventually cracked when positioned over the hot spot exposing the crust to high levels of superheated magma.
9.2 The length of the thermal event determines if the stay over the hot spot is long enough to build an individual island or just a short period that produces a small seamount on the ocean floor. A series of short cooling periods interrupting an overall thermal period would build a chain of superimposed volcanoes as the crust intermittently shifted and then continued lava discharge. Eventually the core begins cooling, and as the high heat content of the crust/mantle boundary moves into the crust and ocean, the fissures are slowly closed causing the volcanoes to become dormant. The crust then moves towards the core increasing the compression against the most recent ridge infill and continues its journey towards the direction of least resistance.
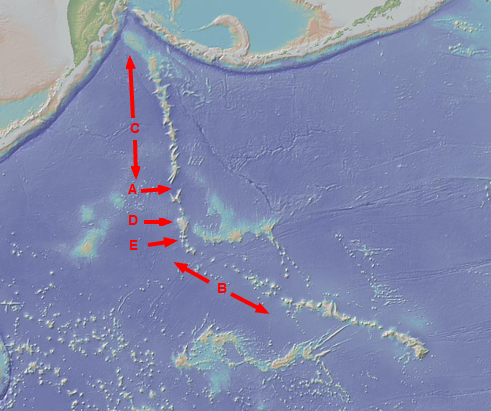
9.21 The sizes of the older seamounts in the northern section (C) seem indicative of larger thermal periods. The seamounts in that upper and older section are all of a footprint of comparable size with each other and the big island of Hawaii which, as everyone knows, is actively building at this time. Those seamounts are assumed to be highly eroded but can reveal by their size and periodicity that they span a period where the mantle would have been producing mantle thermal pulses of increased energy content.
9.22 In contrast the islands or mounts in section (B), although having also eroded downward, can also be reasonably surmised by comparison to the current Hawaiian Islands. The size of these ancient sea mount footprints indicate to me that these are probably not former islands. They are appreciably smaller than the current Big Island of Hawaii, and would indicate that the individual periods of mantle pulses were of a lower energy level than those in area (C) or even the levels at the present time as well. They are after all dependent on the amount of magma available at the crust mantle boundary which is a strain energy dependent quantity that is itself dependent on the thermal expansion of the outer core.
9.23 Thus the spacing indicates that the cycles were mostly dominated by small mantle pulses, especially for the area following the bend. When the mantle was in outward displacement the seamount building periods in these areas appear to have been shorter and/or of lower energy. It would seem that there were simply a series of cycles containing very low energy and/or short periods of outward displacement of the mantle. An important point to note is even though the sizes of the mounts differ greatly between (B) and (C) the actual center to center distances between either group appear to be very similar and would lead me to propose that the speed of the plate's movement during each of these periods was rather similar, area (B) is a very long period of lower energy "mantle thermal pulses", and look's to have actually increased overall from the oldest to the newest.
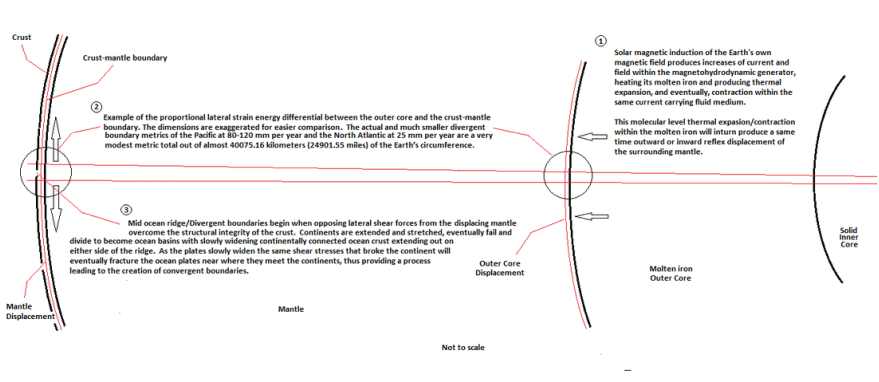
Please return to the top of the page to continue to the next page.
Or click here:
Or click here:
Please contact me and share your thoughts,; Marc Linquist - Researcher - at;